

Mathematics, 17.09.2019 06:00, achewitt3965
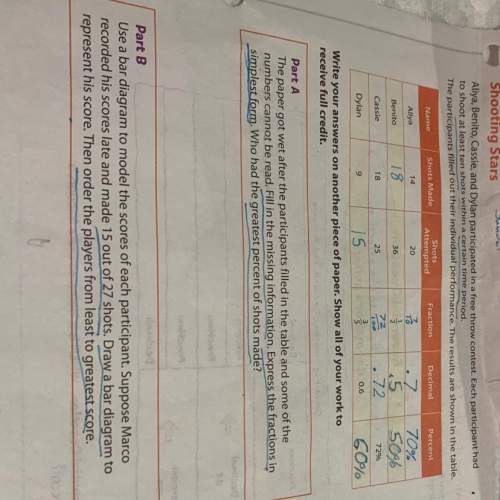
What is marcos score represented on a bar diagram. i have to “show work to receive full credit”

Answers: 2


Other questions on the subject: Mathematics
Mathematics, 21.06.2019 22:00, hannahpalmario
The customer price index(cpi), which measures the cost of a typical package of customer goods, was 208.8 in 2011 and 244.1 in 2016.let x=11 corresponding to the year 2011 an estimate to cpi into 2013 and 2014. assume that the data can be modeled by a straight line and the trend to continue idenfinitely. use data points to find such a line and then estimate the requested quantities
Answers: 1
Mathematics, 22.06.2019 04:30, RichardKing2376
Arandom sample of 15 observations is used to estimate the population mean. the sample mean and the standard deviation are calculated as 172 and 63, respectively. assume that the population is normally distributed. a. with 99 confidence, what is the margin of error for the estimation of the population mean? b. construct the 99% confidence interval for the population mean. c. construct the 95% confidence interval for the population mean. d. construct the 83% confidence interval for the population mean. hint: you need to use excel function =t. inv.2t to find the value of t for the interval calculation.
Answers: 1
Do you know the correct answer?
What is marcos score represented on a bar diagram. i have to “show work to receive full credit”
Questions in other subjects:


Mathematics, 10.06.2020 04:57

English, 10.06.2020 04:57
Social Studies, 10.06.2020 04:57
History, 10.06.2020 04:57


