


Four graphs are shown below:
four graphs are shown. all the graphs show scale on x axis and y...

Mathematics, 12.09.2019 03:30, loloroyroy264
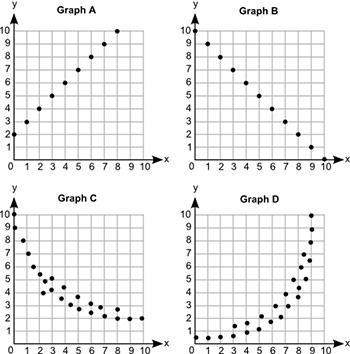
Four graphs are shown below:
four graphs are shown. all the graphs show scale on x axis and y axis from 0 to 10 at increments of 1. graph a shows dots at ordered pairs 0, 2 and 1, 3 and 3, 5 and 4, 6 and 5, 7 and 6, 8 and 7, 9 and 8, 10. graph b shows dots at ordered pairs 0, 10 and 1, 9 and 2, 8 and 3, 7 and 4, 6 and 5, 5 and 6, 4 and 7, 3 and 8, 2 and 9, 1. graph c shows dots at ordered pairs 0, 10 and 0, 9 and 0.9, 8 and 1.1, 7 and 1.5, 6 and 2, 5.5 and 2.1, 4 and 2.5, 4.9 and 3, 4.1 and 3, 5.1 and 3.8, 3.5 and 3.9, 4.5 and 4.2, 3 and 5, 2.8 and 5, 3.8 and 6, 2.4 and 6, 3.1 and 6.8, 2.9 and 7, 2.1 and 8, 2 and 8, 2.8 and 9, 2 and 10, 2. graph d shows dots at the ordered pairs 0, 0.5 and 1, 0.5 and 2, 0.6 and 3, 0.8 and 3.1, 1.5 and 4, 0.9 and 4, 1.8 and 5, 1.1 and 5.1, 2.1 and 5.9, 1.9 and 6.1, 3 and 6.8, 2 and 7, 4 and 7.1, 3 and 7.6, 5 and 8, 3.8 and 8, 4.4 and 8.1, 6 and 8.5, 7 and 8.6, 5 and 8.8, 6.5 and 9, 8 and 9, 9 and 9, 10.
which graph represents a positive linear association between x and y?
graph a
graph b
graph c
graph d

Answers: 1
Other questions on the subject: Mathematics
Mathematics, 21.06.2019 17:30, mduncan840
The marriott family bought a new apartment three years ago for $65,000. the apartment is now worth $86,515. assuming a steady rate of growth, what was the yearly rate of appreciation? what is the percent of the yearly rate of appreciation?
Answers: 1
Mathematics, 21.06.2019 21:00, noahwaitsowl357
Evaluate 5 + 6 · 2 – 8 ÷ 4 + 7 using the correct order of operations. a. 22 b. 11 c. 27 d. 5
Answers: 1
Mathematics, 22.06.2019 01:30, marianasanin2007
Two numbers have a sum of 93. if one number is p, express the other number in terms of p.
Answers: 1
Do you know the correct answer?
Questions in other subjects:

Mathematics, 06.10.2019 05:00

Biology, 06.10.2019 05:00


Spanish, 06.10.2019 05:00


Mathematics, 06.10.2019 05:00


