

Mathematics, 05.09.2019 23:20, kibyrd14
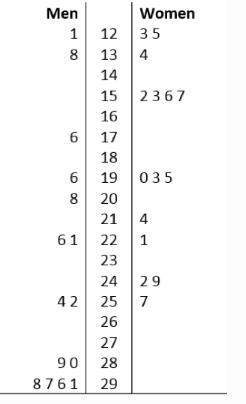
In independent random samples of 15 men and 15 women, the numbers of minutes spent in front of an electronic device are given by the back-to-back stemplot below:
row 1 contents are men; bar; blank; bar; women. row 2 contents are 1; bar; 12; bar; 3, 5. row 3 contents are 8; bar; 13; bar; 4. row 4 contents are blank; bar; 14; bar; blank. row 5 contents are blank; bar; 15; bar; 2, 3, 6, 7. row 6 contents are blank; bar; 16; bar; blank. row 7 contents are 6; bar; 17; bar; blank. row 8 contents are blank; bar; 18; bar; blank. row 9 contents are 6; bar; 19; bar; 0, 3, 5. row 10 contents are 8; bar; 20; blank. row 11 contents are blank; bar; 21; bar; 4. row 12 contents are 6, 1; bar; 22; bar; 1. row 13 contents are blank; bar; 23; bar; blank. row 14 contents are blank; bar; 24; bar; 2, 9. row 15 contents are 4, 2; bar; 25; bar; 7. row 16 contents are blank; bar; 26; bar; blank. row 17 contents are blank; bar; 27; bar; blank. row 18 contents are 9, 0; bar; 28; bar; blank. row 19 contents are 8, 7, 6, 1; bar; 29; bar; blank.
part a: describe the shape of each data set. (3 points)
part b: josephine analyzed the data and stated that the better measure of center for the women is the mean. is josephine correct? explain your reasoning. (3 points)
part c: josephine decided there are no outliers in the men's data set. is she correct? justify your answer mathematically. (4 points) (10 points

Answers: 1


Other questions on the subject: Mathematics
Mathematics, 21.06.2019 17:50, tiffcarina69
F(x) = x2 − 9, and g(x) = x − 3 f(x) = x2 − 4x + 3, and g(x) = x − 3 f(x) = x2 + 4x − 5, and g(x) = x − 1 f(x) = x2 − 16, and g(x) = x − 4 h(x) = x + 5 arrowright h(x) = x + 3 arrowright h(x) = x + 4 arrowright h(x) = x − 1 arrowright
Answers: 2
Do you know the correct answer?
In independent random samples of 15 men and 15 women, the numbers of minutes spent in front of an el...
Questions in other subjects:

English, 13.04.2021 18:30
Mathematics, 13.04.2021 18:30
Mathematics, 13.04.2021 18:30


Computers and Technology, 13.04.2021 18:30
Mathematics, 13.04.2021 18:30
Mathematics, 13.04.2021 18:30


