


Some one
luis created the graph below to show the temperature from 8: 00 a. m. (8 hours after...

Mathematics, 04.09.2019 23:10, korban23
Some one
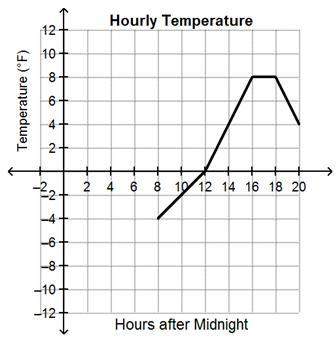
luis created the graph below to show the temperature from 8: 00 a. m. (8 hours after midnight) until 8: 00 p. m.
which statements are true about the temperatures luis recorded on the graph? check all that apply.
a. the temperature increased until 4: 00 p. m.
b. the temperature was not recorded between 4: 00 p. m. and 6: 00 p. m.
c. the temperature decreased after 6: 00 p. m.
d. the temperature increased and then decreased before holding constant.
e. the temperature increased more quickly between 12: 00 p. m. and 4: 00 p. m. than before 12: 00 p. m.

Answers: 3
Other questions on the subject: Mathematics
Mathematics, 21.06.2019 15:30, mathman783
Which polynomial function has x intercepts -1, 0, and 2 and passes through the point (1, -6)
Answers: 2
Mathematics, 21.06.2019 17:10, ivilkas23
The frequency table shows a set of data collected by a doctor for adult patients who were diagnosed with a strain of influenza. patients with influenza age range number of sick patients 25 to 29 30 to 34 35 to 39 40 to 45 which dot plot could represent the same data as the frequency table? patients with flu
Answers: 2
Mathematics, 21.06.2019 19:30, AriesTwice
Acollection of coins has value of 64 cents. there are two more nickels than dimes and three times as many pennies as dimes in this collection. how many of each kind of coin are in the collection?
Answers: 1
Mathematics, 21.06.2019 21:00, kprincess16r
Choose the equation below that represents the line that passes through the point (2, 4) and has a slope of 3. a) y − 4 = 3(x − 2) b) y − 2 = 3(x − 4) c) y + 4 = 3(x + 2) d) y + 2 = 3(x + 4)
Answers: 1
Do you know the correct answer?
Questions in other subjects:


History, 05.11.2020 16:00

English, 05.11.2020 16:00
English, 05.11.2020 16:00
History, 05.11.2020 16:00


