


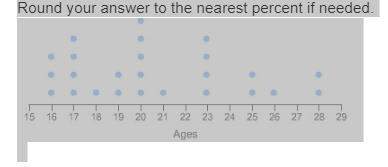
The line plot shows the ages of people taking a driving test at a certain station one day.
wha...

Mathematics, 29.08.2019 20:00, bnn29
The line plot shows the ages of people taking a driving test at a certain station one day.
what percent of the people are 18 or younger?
round your answer to the nearest percent if needed.
a line plot titled ages from 15 to 29. the plot displays the following values as dots above the corresponding value on the number line. three dots at 16. four dots at 17. one dot at 18. two dots at 19. five dots at 20. one dot at 21. four dots at 23. two dots at 25. one dot at 26. two dots at 28.
32%
28%
25%
17%

Answers: 3
Other questions on the subject: Mathematics
Mathematics, 21.06.2019 16:30, kittylover613
Ivan and jeff buy a package of 8 pens for $4.00. ivan wants 5 of the pens, and jeff wants 3.how much should each student pay?
Answers: 1
Mathematics, 21.06.2019 18:00, abhibhambhani
Mozart lenses inc. recently introduced seelites, a thinner lens for eyelasses. of a sample of 800 eyeglass wearers, 246 said they would purchases their next pair of eyeglasses with the new lenses. lenses inc. estimates that the number of people who purchase eyeglasses in a year is 1,700,000. most eyeglasses wearer buy one new pair of eyeglasses a year. what is the annual sales potential for the new lenses.
Answers: 1
Do you know the correct answer?
Questions in other subjects:


History, 04.07.2019 15:00


