
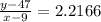
![\frac{y-y_1}{x-x_1}=]\frac{y_2-y_1}{x_2-x_1}](/tpl/images/0198/1423/4d7d0.png)


For 1983 through 1989, the per capita consumption of chicken in the u. s. increased at a
rate t...

Mathematics, 26.08.2019 03:20, chloe1107
For 1983 through 1989, the per capita consumption of chicken in the u. s. increased at a
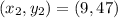
rate that was approximately linear. in 1983,
the per capita consumption was 33.7 pounds,
and in 1989 it was 47 pounds.
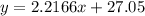
write a linear model for per capita consumption of chicken in the u. s. let t represent time in years, where t = 3 represents
1983. let y represent chicken consumption in
pounds.
1. y = t + 27.05
2. y = 2.21667t
3. y = 27.05
4. y = 2.21667t − 27.05
5. y = 2.21667t + 27.05

Answers: 3
Other questions on the subject: Mathematics
Mathematics, 21.06.2019 18:30, 25jzaldivar
Players on the school soccer team are selling candles to raise money for an upcoming trip. each player has 24 candles to sell. if a player sells 4 candles a profit of$30 is made. if he sells 12 candles a profit of $70 is made
Answers: 2
Mathematics, 21.06.2019 19:10, alarconanais07
Labc is reflected across x = 1 and y = -3. what are the coordinates of the reflection image of a after both reflections?
Answers: 3
Mathematics, 22.06.2019 00:00, genyjoannerubiera
Iwill arward ! , i if bt ≅ eu , bu ≅ et , prove: ∠b ≅ ∠e. fill in the blanks: draw segment ut ≅ bt≅ bu ≅ △ubt ≅ △
Answers: 1
Do you know the correct answer?
Questions in other subjects:


Social Studies, 25.07.2019 18:00

Computers and Technology, 25.07.2019 18:00


Health, 25.07.2019 18:00


