

Mathematics, 26.08.2019 03:10, isamar4348
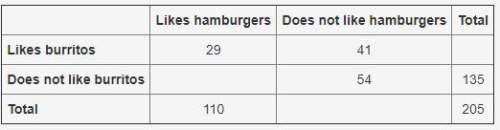
Afood truck did a daily survey of customers to find their food preferences. the data is partially entered in the frequency table. complete the table to analyze the data and answer the questions:
part a: what percentage of the survey respondents did not like either hamburgers or burritos?
part b: create a relative frequency table and determine what percentage of students who like hamburgers also like burritos.
part c: use the conditional relative frequencies to determine which two data point has strongest association of its two factors. use complete sentences to explain your answer.

Answers: 3


Other questions on the subject: Mathematics
Mathematics, 21.06.2019 22:30, cramirezorozco392
Whit h equation best represents this situation the number 98 increased by an unknown number equal to 120
Answers: 1
Mathematics, 22.06.2019 00:00, mattiemattoos
One of the complementary angles is 4 degrees mor than the other. find the angles (recall that complementary angles are angles whose sum is 90 degrees.) which of the following can not be used to solve the problem if x represents one of the angles? a. 2x-4=90 b. 2x+4=90 c. x+4=90
Answers: 1
Do you know the correct answer?
Afood truck did a daily survey of customers to find their food preferences. the data is partially en...
Questions in other subjects:

History, 18.06.2020 01:57
Mathematics, 18.06.2020 01:57


Mathematics, 18.06.2020 01:57

Health, 18.06.2020 01:57
History, 18.06.2020 01:57


