

Mathematics, 07.08.2019 21:30, peno211
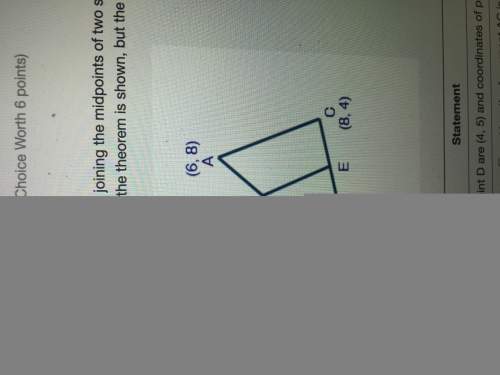
Theorem: the segment joining the midpoints of two sides of a triangle is parallel to the third side and half its length.
a two-column proof of the theorem is shown, but the proof is incomplete.
statement reason
the coordinates of point d are (4, 5) and coordinates of point e are (5, 3) by the midpoint formula
length of segment de is square root of 5 and length of segment ac is 2 multiplied by the square root of 5 by the distance formula
segment de is half the length of segment ac by substitution
slope of segment de is −2 and slope of segment ac is −2
segment de is parallel to segment ac slopes of parallel lines are equal
which of the following completes the proof?
a) by definition of congruence
b)addition property of equality
c) by construction
d)by the slope formula

Answers: 2


Other questions on the subject: Mathematics
Mathematics, 21.06.2019 17:30, cfnewton09
Astudent survey asked: "how tall are you (in inches)? " here's the data: 67, 72, 73, 60, 65, 86, 72, 69, 74 give the five number summary. a. median: 73, mean: 70.89, iqr: 5, min: 60, max: 74 b. 60, 66, 72, 73.5, 86 c. 60, 67, 72, 73, 74 d. 0, 60, 70, 89, 74, 100
Answers: 3
Mathematics, 21.06.2019 18:20, mairealexander87
The total cost of anja’s trip to the dentist was $628.35. she paid a flat fee of $89.95 which included the checkup and cleaning and then had 4 cavities filled, each of which cost the same amount. which shows the correct equation and value of x, the cost of each cavity filling?
Answers: 2
Mathematics, 22.06.2019 01:00, s27511583
The weight of 46 new patients of a clinic from the year 2018 are recorded and listed below. construct a frequency distribution, using 7 classes. then, draw a histogram, a frequency polygon, and an ogive for the data, using the relative information from the frequency table for each of the graphs. describe the shape of the histogram. data set: 130 192 145 97 100 122 210 132 107 95 210 128 193 208 118 196 130 178 187 240 90 126 98 194 115 212 110 225 187 133 220 218 110 104 201 120 183 124 261 270 108 160 203 210 191 180 1) complete the frequency distribution table below (add as many rows as needed): - class limits - class boundaries - midpoint - frequency - cumulative frequency 2) histogram 3) frequency polygon 4) ogive
Answers: 1
Do you know the correct answer?
Theorem: the segment joining the midpoints of two sides of a triangle is parallel to the third side...
Questions in other subjects:

Mathematics, 02.09.2019 03:10
Mathematics, 02.09.2019 03:10
Mathematics, 02.09.2019 03:10


Mathematics, 02.09.2019 03:10
English, 02.09.2019 03:10


