

Mathematics, 03.08.2019 01:10, jameanch7182
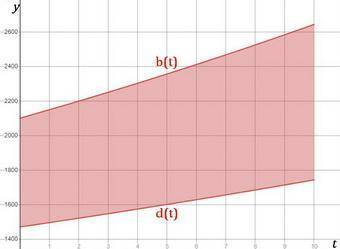
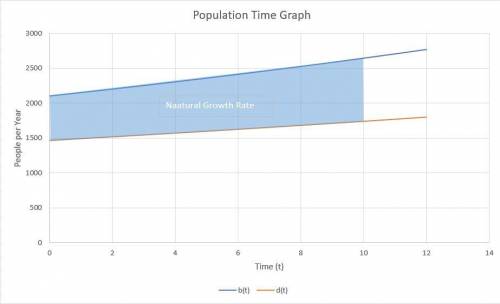
The birth rate of a population is b(t) = 2100e0.023t people per year and the death rate is d(t)= 1470e0.017t people per year, find the area between these curves for 0 ≤ t ≤ 10. (round your answer to the nearest integer.) what does this area represent? a. this area represents the number of deaths over a 10-year period. b. this area represents the number of births over a 10-year period. c. this area represents the decrease in population over a 10-year period. d. this area represents the increase in population over a 10-year period. e. this area represent the number of children through high school over a 10-year period.

Answers: 1
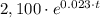

![A = \displaystyle \int\limits^{10}_0 {2,100 \cdot e^{0.023 \cdot t}-1,470\cdot e^{0.017 \cdot t}} \, dt = \left[\frac{2,100}{0.023} \cdot e^{0.023 \cdot t} - \frac{1,470}{0.017} \cdot e^{0.017 \cdot t}\right]^{10}_0](/tpl/images/0163/7975/d9dd4.png)
![\displaystyle A = \left[\frac{2,100}{0.023} \cdot e^{0.023 \cdot t} - \frac{1,470}{0.017} \cdot e^{0.017 \cdot t}\right]^{10}_0 \approx 7,587.9](/tpl/images/0163/7975/90ffd.png)
![A = \displaystyle \int_{0}^{10}[b(t) - d(t)]dt\\\\A = \displaystyle \int_{0}^{10}[2100e^{0.023t} - 1470e^{0.017t}]dt\\\\A = \left [ \dfrac{2100}{0.023}e^{0.023t} - \dfrac{1470}{0.017 }e^{0.017t}\right ]_{0}^{10}\\\\](/tpl/images/0163/7975/b9468.png)
![A = \left [ 91304e^{0.023t} - 86471e^{0.017t}\right ]_{0}^{10}\\\\A = \left [91304e^{0.23} - 86471e^{0.17} \right ] - [91304- 86471] \\\\A = 91304 \times 1.259 - 86471\times 1.185 - 4834 = 114916 - 102494 - 4834 = \mathbf{7588}\\\\\text{The area between the two curves is $\boxed{\mathbf{7588}}$}](/tpl/images/0163/7975/cee64.png)


Other questions on the subject: Mathematics
Mathematics, 21.06.2019 14:10, mbatton879
5500 dollars is placed in an account with an annual interest rate of 6.5%. to the nearest tenth of a year, how long will it take for the account value to reach 19700 dollars?
Answers: 2
Mathematics, 21.06.2019 17:40, PONBallfordM89
How can the correlation in the scatter plot graph below best be described? positive correlation negative correlation both positive and negative no correlation
Answers: 1
Mathematics, 21.06.2019 21:00, Liantic8738
Oliver read for 450 minutes this month his goal was to read for 10% more minutes next month if all of her medicine go how many minutes will you read all during the next two months
Answers: 3
Do you know the correct answer?
The birth rate of a population is b(t) = 2100e0.023t people per year and the death rate is d(t)= 147...
Questions in other subjects:


