


The box plots show the weights, in pounds, of the dogs in two different animal shelters.
weigh...

Mathematics, 21.07.2019 19:10, ld966057
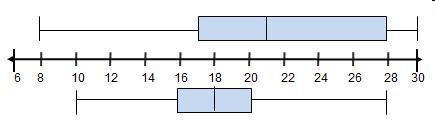
The box plots show the weights, in pounds, of the dogs in two different animal shelters.
weights of dogs in shelter a (top plot)
weights of dogs in shelter b(bottom plot)
which correctly compares the ranges of the data?
the range in shelter a is 11, and the range in shelter b is 4.
the range in shelter a is 20, and the range in shelter b is 10.
the range in shelter a is 13, and the range in shelter b is 8.
the range in shelter a is 22, and the range in shelter b is 18.

Answers: 2
Similar questions

Biology, 18.07.2019 23:20, yousifgorgees101
Answers: 2
Mathematics, 19.07.2019 06:10, nat8475
Answers: 2
Mathematics, 21.07.2019 20:10, samanthablain192
Answers: 1
Mathematics, 08.08.2019 20:20, AllisonMcruther
Answers: 1
Do you know the correct answer?
Questions in other subjects:

Computers and Technology, 20.04.2020 15:42

History, 20.04.2020 15:42
Mathematics, 20.04.2020 15:42
Mathematics, 20.04.2020 15:42
Mathematics, 20.04.2020 15:43


