


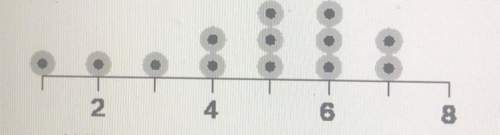
2. consider the following line plot.
(a) what is the general trend of the graph?
(b) wh...

Mathematics, 16.07.2019 19:40, maibelgarza
2. consider the following line plot.
(a) what is the general trend of the graph?
(b) what is the median of the data? explain.
(c) what is the mean of the data? explain. round to the nearest tenth.
(d) would the mean or median be affected more with a data point of 20? explain.

Answers: 2
Other questions on the subject: Mathematics
Mathematics, 21.06.2019 20:30, talexander131
The difference between two numbers is one. three times the larger number minus two times the smaller number is 9. what are the two numbers
Answers: 3
Mathematics, 21.06.2019 21:30, natalieburnett82
Ihave a triangle with a 60 degree angle. lets use d for that angle. what are the values of e and f if d is 60 degrees? and what do you notice about the values of e and f?
Answers: 2
Do you know the correct answer?
Questions in other subjects:

Physics, 12.04.2021 19:00

Law, 12.04.2021 19:00
Mathematics, 12.04.2021 19:00


Mathematics, 12.04.2021 19:00


