

Mathematics, 13.07.2019 06:10, marykayy0218own5cp
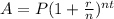
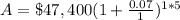
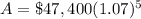
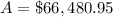
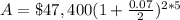
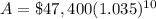
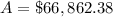
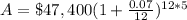
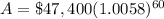
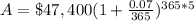
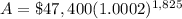
If 47400 dollars is invested at an interest rate of 7 percent per year, find the value of the investment at the end of 5 years for the following compounding methods, to the nearest cent.
(a) annual: $
(b) semiannual: $
(c) monthly: $
(d) daily: $

Answers: 3


Other questions on the subject: Mathematics
Mathematics, 21.06.2019 22:30, jcazares3558
Abag contains 10 white golf balls and 6 striped golf balls. a golfer wants to add 112 golf balls to the bag. he wants the ratio of white to striped gold balls to remain the same. how many of each should he add?
Answers: 2
Mathematics, 21.06.2019 22:30, Calmalemi
Marquise has 200 meters of fencing to build a rectangular garden. the garden's area (in square meters) as a function of the garden's width w w (in meters) is modeled by: a ( w ) = − w 2 + 1 0 0 w a(w)=−w 2 +100w what side width will produce the maximum garden area? meters
Answers: 1
Mathematics, 22.06.2019 02:30, misk980
Atrain traveled for 1.5 hours to the first station, stopped for 30 minutes, then traveled for 4 hours to the final station where it stopped for 1 hour. the total distance traveled is a function of time. which graph most accurately represents this scenario? a graph is shown with the x-axis labeled time (in hours) and the y-axis labeled total distance (in miles). the line begins at the origin and moves upward for 1.5 hours. the line then continues upward at a slow rate until 2 hours. from 2 to 6 hours, the line continues quickly upward. from 6 to 7 hours, it moves downward until it touches the x-axis a graph is shown with the axis labeled time (in hours) and the y axis labeled total distance (in miles). a line is shown beginning at the origin. the line moves upward until 1.5 hours, then is a horizontal line until 2 hours. the line moves quickly upward again until 6 hours, and then is horizontal until 7 hours a graph is shown with the axis labeled time (in hours) and the y-axis labeled total distance (in miles). the line begins at the y-axis where y equals 125. it is horizontal until 1.5 hours, then moves downward until 2 hours where it touches the x-axis. the line moves upward until 6 hours and then moves downward until 7 hours where it touches the x-axis a graph is shown with the axis labeled time (in hours) and the y-axis labeled total distance (in miles). the line begins at y equals 125 and is horizontal for 1.5 hours. the line moves downward until 2 hours, then back up until 5.5 hours. the line is horizontal from 5.5 to 7 hours
Answers: 1
Do you know the correct answer?
If 47400 dollars is invested at an interest rate of 7 percent per year, find the value of the invest...
Questions in other subjects:

Mathematics, 14.12.2019 04:31

History, 14.12.2019 04:31


