


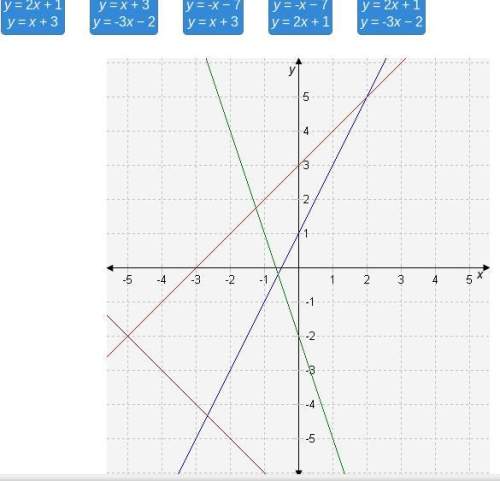
Drag each system of equations to the correct location on the graph.
match each system of equat...

Mathematics, 11.07.2019 21:30, eriter659
Drag each system of equations to the correct location on the graph.
match each system of equations to its point of intersection.

Answers: 3
Other questions on the subject: Mathematics
Mathematics, 21.06.2019 22:00, deannajd03
Which two transformations are applied to pentagon abcde to create a'b'c'd'e'? (4 points) translated according to the rule (x, y) ? (x + 8, y + 2) and reflected across the x-axis translated according to the rule (x, y) ? (x + 2, y + 8) and reflected across the y-axis translated according to the rule (x, y) ? (x + 8, y + 2) and reflected across the y-axis translated according to the rule (x, y) ? (x + 2, y + 8) and reflected across the x-axis
Answers: 1
Mathematics, 22.06.2019 01:00, reganleigh00
The correlation coefficient between the number of students and marks obtained in end semester exam. (13 marks) give the statistical meaning of the relationship between the number of students and marks b. obtained in end semester exam. (3 marks) draw the number of students and marks obtained in end semester exam scatter diagram c. (4 marks) check list write your name and id corectly write the question number properly use your own calculator. show all the steps to solve the problems. use the correct formula. answer in provided time. don't use your mobile for any purpose. write your answer up to two decimal places
Answers: 3
Mathematics, 22.06.2019 01:00, s27511583
The weight of 46 new patients of a clinic from the year 2018 are recorded and listed below. construct a frequency distribution, using 7 classes. then, draw a histogram, a frequency polygon, and an ogive for the data, using the relative information from the frequency table for each of the graphs. describe the shape of the histogram. data set: 130 192 145 97 100 122 210 132 107 95 210 128 193 208 118 196 130 178 187 240 90 126 98 194 115 212 110 225 187 133 220 218 110 104 201 120 183 124 261 270 108 160 203 210 191 180 1) complete the frequency distribution table below (add as many rows as needed): - class limits - class boundaries - midpoint - frequency - cumulative frequency 2) histogram 3) frequency polygon 4) ogive
Answers: 1
Do you know the correct answer?
Questions in other subjects:


Mathematics, 03.09.2020 21:01

Mathematics, 03.09.2020 21:01

Social Studies, 03.09.2020 21:01

History, 03.09.2020 21:01


