
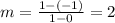
 .... (1)
 .... (2)
 and
and  , then slope of the line is
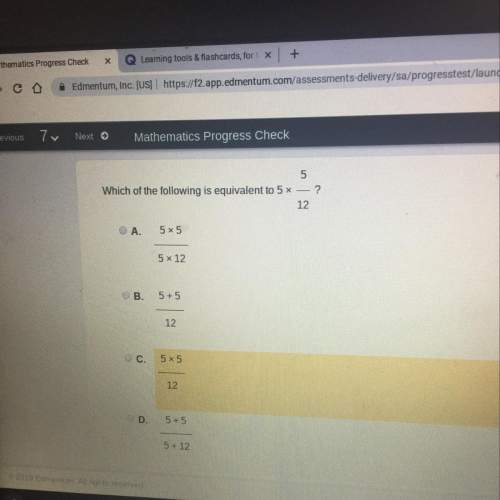


The equation represents function a, and the graph represents function b:
function a: f...

Mathematics, 15.10.2019 03:30, orangeicecream
The equation represents function a, and the graph represents function b:
function a: f(x) = x − 9
which equation best compares the slopes of the two functions?
a.) slope of function b = 2 x slope of function a
b.) slope of function a = slope of function b
c.) slope of function a = 2 x slope of function b
d.) slope of function b = − slope of function a

Answers: 3
Other questions on the subject: Mathematics
Mathematics, 21.06.2019 20:00, brunovillarreal6576
Find the slope of the line passing through a pair of points
Answers: 2
Mathematics, 21.06.2019 20:30, aavil5659
Clarence wants to buy a new car. he finds an ad for a car that costs 27,200 dollars. suppose his local sales tax is 7%. -how much would he have to pay? -what is the cost of the car including tax? -if clarence has 29,864 saved, can he pay cash to buy the car?
Answers: 1
Mathematics, 21.06.2019 23:00, ptrlvn01
1. an economy consists of three workers: larry, moe, and curly. each works 10 hours a day and can produce two services: mowing lawns and washing cars. in an hour, larry can either mow one lawn or wash one car; moe can either mow one lawn or wash two cars; and curly can either mow two lawns or wash one car. a. calculate how much of each service is produced under the following circumstances: a. all three spend all their time mowing lawns. b. all three spend all their time washing cars. c. all three spend half their time on each activity d. larry spends half of his time on each activity, while moe only washes cars and curly only mows lawns b. using your answers to part a, draw a production possibilities frontier and label points a, b, c, and d on your graph. explain why the production possibilities frontier has the shape it does. c. are any of the allocations calculated in part a inefficient? explain.
Answers: 3
Mathematics, 21.06.2019 23:30, byron17
Select the correct answer from each drop-down menu. james needs to clock a minimum of 9 hours per day at work. the data set records his daily work hours, which vary between 9 hours and 12 hours, for a certain number of days. {9, 9.5, 10, 10.5, 10.5, 11, 11, 11.5, 11.5, 11.5, 12, 12}. the median number of hours james worked is . the skew of the distribution is
Answers: 3
Do you know the correct answer?
Questions in other subjects:

Arts, 27.05.2021 17:40

Business, 27.05.2021 17:40

Chemistry, 27.05.2021 17:40
Arts, 27.05.2021 17:40
Chemistry, 27.05.2021 17:40
Mathematics, 27.05.2021 17:40
Mathematics, 27.05.2021 17:40


