

Mathematics, 21.06.2019 14:10, valeriam24
which best describes the transformation from the graph of f(x) = x2 to the graph of f(x) = (x – 3)2 – 1? left 3 units, down 1 unitleft 3 units, up 1 unitright 3 units, down 1 unit right 3 units, up 1 unit

Answers: 1
 , then the function is shifted down "k" units.
 , then the function is shifted right "k" units.
 to the graph of the function
 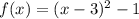 . This is:


Other questions on the subject: Mathematics
Mathematics, 21.06.2019 18:30, angelapegues20097
Tyler enjoys the fish so much that after his birthday his family decides to take him to a famous aquarium a tank at the aquarium is similar to his tank with the scale factor of 8 how many times greater is the volume of the tank at the aquarium than the volume of tyler tank
Answers: 2
Mathematics, 21.06.2019 21:30, shymitch32
Create a graph for the demand for starfish using the following data table: quantity/price of starfish quantity (x axis) of starfish in dozens price (y axis) of starfish per dozen 0 8 2 6 3 5 5 2 7 1 9 0 is the relationship between the price of starfish and the quantity demanded inverse or direct? why? how many dozens of starfish are demanded at a price of five? calculate the slope of the line between the prices of 6 (quantity of 2) and 1 (quantity of 7) per dozen. describe the line when there is a direct relationship between price and quantity.
Answers: 3
Do you know the correct answer?
which best describes the transformation from the graph of f(x) = x2 t...
Questions in other subjects:

English, 02.07.2019 04:30
Mathematics, 02.07.2019 04:30


History, 02.07.2019 04:30

Geography, 02.07.2019 04:30
English, 02.07.2019 04:30
Mathematics, 02.07.2019 04:30
History, 02.07.2019 04:30


