

Mathematics, 24.06.2019 08:30, winwinphyo
The graph below is used by company 2 to show the average monthly electric cost based on the electricity provider. how could the graph be redrawn so that the difference in monthly electric cost does not appear as great? the scale on the y-axis could be changed to 0–150. the scale on the y-axis could be changed to 100–120. the interval on the y-axis could be changed to count by 1s. the interval on the y-axis could be changed to count by 20s.

Answers: 1


Other questions on the subject: Mathematics
Mathematics, 22.06.2019 05:00, jhenifelix
Mario and luigi were printing calendars mario used 2 1/2 ink cartridges while luigi used 1 3/4 ink cartridges .how many more ink cartridges did mario use than luigi
Answers: 1
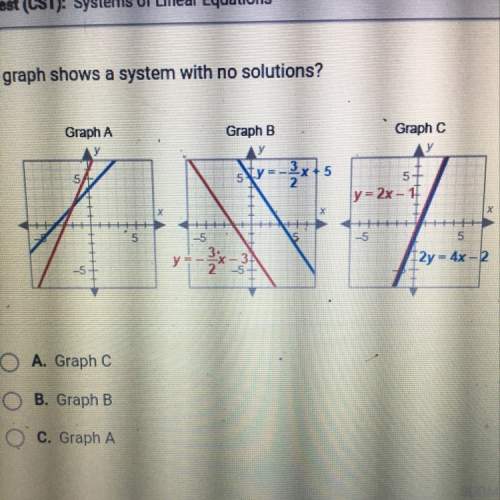
Do you know the correct answer?
The graph below is used by company 2 to show the average monthly electric cost based on the electric...
Questions in other subjects:

Mathematics, 02.02.2021 21:20
Mathematics, 02.02.2021 21:20

Biology, 02.02.2021 21:20
English, 02.02.2021 21:20

Arts, 02.02.2021 21:20


