

Mathematics, 17.10.2019 14:30, jazzhands16
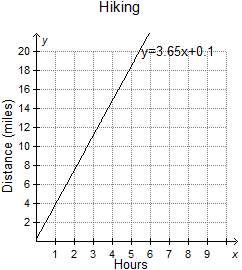
The graph shows the best-fit regression model for a set of data comparing the number of hours spent hiking and the number of miles traveled in one day.
which is most likely true of the data set represented by the regression model on the graph?
a) each point in the data set falls on the regression line.
b)the regression model is an accurate representation of the distance for any number of hours hiked.
c)each point in the data set is near the regression line.
d)the regression model is inaccurate, as it does not begin at (0, 0). \

Answers: 3


Other questions on the subject: Mathematics
Mathematics, 21.06.2019 17:30, sabrinarasull1pe6s61
Find the zero function by factoring (try to show work) h(x)=-x^2-6x-9
Answers: 2
Mathematics, 21.06.2019 18:30, singlegirlforlife541
Maria walks a round trip of 0.75 mile to school every day. how many miles will she walk in 4.5 days
Answers: 2
Mathematics, 21.06.2019 23:40, alyxkellar06
From the top of a tree a bird looks down on a field mouse at an angle of depression of 50°. if the field mouse is 40 meters from the base of the tree, find the vertical distance from the ground to the bird's eyes.
Answers: 1
Do you know the correct answer?
The graph shows the best-fit regression model for a set of data comparing the number of hours spent...
Questions in other subjects:

Chemistry, 11.10.2019 19:30


Mathematics, 11.10.2019 19:30
Social Studies, 11.10.2019 19:30


Health, 11.10.2019 19:30


