

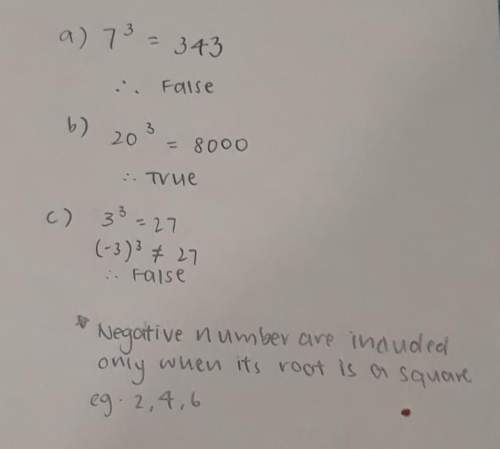
Mathematics, 27.06.2019 12:00, 030702princessjs
The following data give the one-way commuting times (in minutes) from home to work for a random sample of 50 workers. 23 17 34 26 18 33 46 42 12 37 44 15 22 19 28 32 18 39 40 48 1611 924182631 73015 18 22 29 32 30 21 19 14 26 37 25 36 23 39 42 46 29 17 24 31 a. make a histogram for these data. b. prepare a stem-and-leaf display for these data. c. make a dotplot for these data.

Answers: 2


Other questions on the subject: Mathematics
Mathematics, 21.06.2019 16:30, brysonsandridge69041
Diana is painting statues she has 7/8 of a liter of paint each statue requires 1/20 of a liter of paint how many statues can she paint?
Answers: 1
Do you know the correct answer?
The following data give the one-way commuting times (in minutes) from home to work for a random samp...
Questions in other subjects:


Mathematics, 12.10.2019 08:10

Mathematics, 12.10.2019 08:10
Mathematics, 12.10.2019 08:10

Biology, 12.10.2019 08:10


