

Mathematics, 29.11.2019 14:31, glitterforever2739
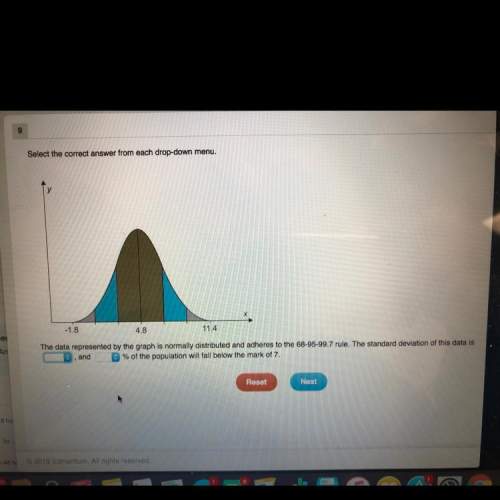
The data represented by the graph is normally distributed and adheres to the 68-95-99.7 rule. the standard deviation of this data is (drop down menu), and (drop down menu2)% of the population will fall below the mark of 7.
drop down menu1-
-6.6
1.8
2.2
4.8
drop down menu2-
34
68
84
95

Answers: 1


Other questions on the subject: Mathematics
Mathematics, 21.06.2019 16:50, charlotte67
Which of the following points is collinear with (-2,1) and (0,3)
Answers: 3
Mathematics, 21.06.2019 20:30, PONBallfordM89
Adecibel is a logarithmic unit that can be used to measure the intensity of a sound. the function y = 10logx gives the intensity of a sound in decibels, where x is the ratio of the intensity of the sound to a reference intensity. the reference intensity is generally set at the threshold of hearing. use the graphing utility to graph the decibel function. a whisper has a sound intensity of 30 decibels. use your graph to you complete the following statement. the sound intensity of a whisper is times the reference intensity.
Answers: 1
Mathematics, 21.06.2019 21:20, drakesmith43
Identify one charcteristic of exponential growth
Answers: 3
Mathematics, 21.06.2019 23:30, Coolcatfurzy
Fill in the table with whole numbers to make 430 in five different ways
Answers: 1
Do you know the correct answer?
The data represented by the graph is normally distributed and adheres to the 68-95-99.7 rule. the st...
Questions in other subjects:


History, 05.06.2020 05:01


English, 05.06.2020 05:01
Mathematics, 05.06.2020 05:01


