


Someone !
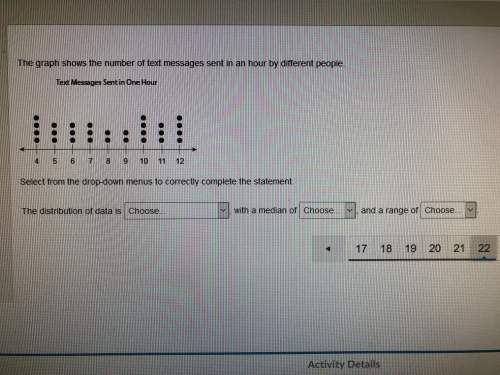
1. the distribution of data is a. approximately normal b. skewed left c. skewed righ...

Mathematics, 30.01.2020 18:53, sherifour
Someone !
1. the distribution of data is a. approximately normal b. skewed left c. skewed right d. approximately uniform
2. with a median of a. 7 b. 7.5 c. 8 d. 8.5
3. and a range of a. 4 b. 8 c. 10 d. 12

Answers: 3
Other questions on the subject: Mathematics
Mathematics, 22.06.2019 00:00, hdwoody2002
Percy rides his bike 11.2 miles in 1.4 hours at a constant rate. write an equation to represent the proportional relationship between the number of hours percy rides, x, and the distance in miles, y, that he travels.
Answers: 1
Mathematics, 22.06.2019 01:30, michaela134
Aresearch study is done to find the average age of all u. s. factory workers. the researchers asked every factory worker in ohio what their birth year is. this research is an example of a census survey convenience sample simple random sample
Answers: 3
Mathematics, 22.06.2019 02:00, mathhelppls14
1. the manager of collins import autos believes the number of cars sold in a day (q) depends on two factors: (1) the number of hours the dealership is open (h) and (2) the number of salespersons working that day (s). after collecting data for two months (53 days), the manager estimates the following log-linear model: q 4 equation 1 a. explain, how to transform the log-linear model into linear form that can be estimated using multiple regression analysis. the computer output for the multiple regression analysis is shown below: q4 table b. how do you interpret coefficients b and c? if the dealership increases the number of salespersons by 20%, what will be the percentage increase in daily sales? c. test the overall model for statistical significance at the 5% significance level. d. what percent of the total variation in daily auto sales is explained by this equation? what could you suggest to increase this percentage? e. test the intercept for statistical significance at the 5% level of significance. if h and s both equal 0, are sales expected to be 0? explain why or why not? f. test the estimated coefficient b for statistical significance. if the dealership decreases its hours of operation by 10%, what is the expected impact on daily sales?
Answers: 2
Do you know the correct answer?
Questions in other subjects:
Mathematics, 17.11.2020 21:10
Mathematics, 17.11.2020 21:10


History, 17.11.2020 21:10

Biology, 17.11.2020 21:10
Mathematics, 17.11.2020 21:10
Mathematics, 17.11.2020 21:10


