


Take all my points me
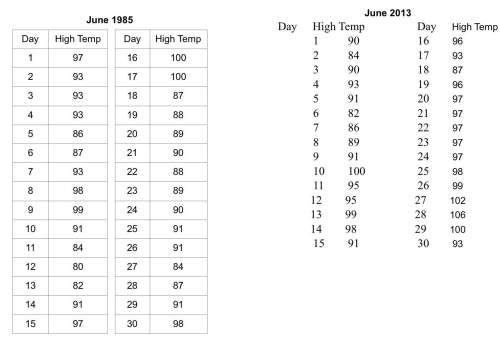
the high temperatures for dallas, texas in june 1985 and june 2013 are...

Mathematics, 17.01.2020 03:31, savageyvens
Take all my points me
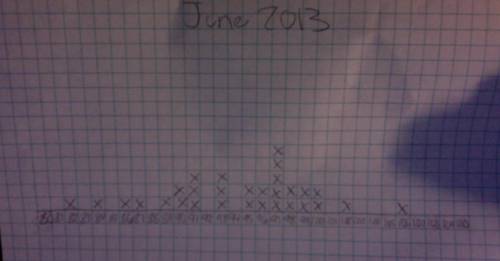
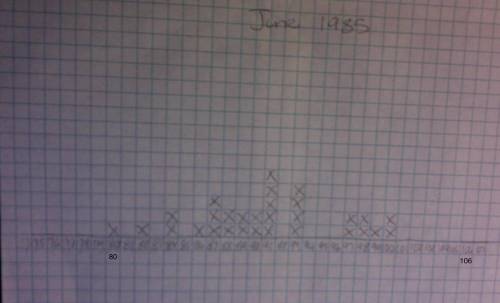
the high temperatures for dallas, texas in june 1985 and june 2013 are shown. use the data to create a comparative dot plot and comparative box plot and use them to compare the weather then and now. remember to use at least two module vocabulary words in your responses.
1. create a comparative dot plot for the data sets.
2. assess the degree of overlap between the data sets and compare the shapes, centers, and spreads of the two groups using the comparative dot plot.
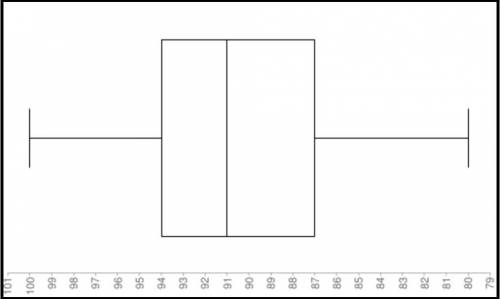
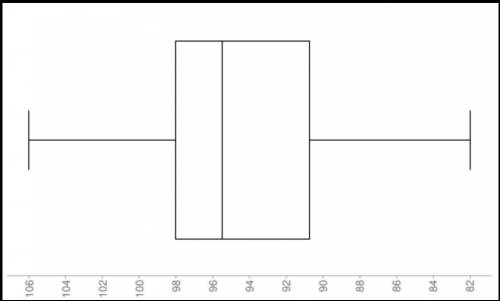
3. create a comparative box plot for the data sets.
4. assess the degree of overlap between the data sets and compare the shapes, centers, and spreads of the two groups using the comparative box plot.

Answers: 1
Other questions on the subject: Mathematics
Mathematics, 21.06.2019 16:00, Xghoued2056
Apark is in the shape of a rectangle. the park authorities are planning to build a 2-meter-wide jogging path in the park (shown as the shaded region in the image). what is the area of the jogging path? plz
Answers: 1
Do you know the correct answer?
Questions in other subjects:
Mathematics, 06.09.2019 21:20

Spanish, 06.09.2019 21:20

Mathematics, 06.09.2019 21:20


Biology, 06.09.2019 21:20
Mathematics, 06.09.2019 21:20
Health, 06.09.2019 21:20


