

Mathematics, 24.12.2019 23:31, fatty18
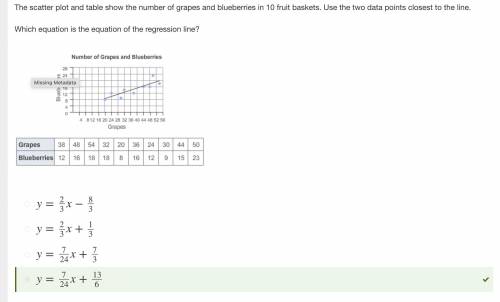
The scatter plot and table show the number of grapes and blueberries in 10 fruit baskets.
when you use the two data points closest to the line, which is the equation of the regression line?
a.
y = 2/3x + 1/3
b.
y = 2/3x - 8/3
c.
y = 7/24x + 7/3
d.
y=7/24x + 13/6

Answers: 2


Other questions on the subject: Mathematics
Mathematics, 21.06.2019 20:20, kenken2583
Complete the input-output table for the linear function y = 3x. complete the input-output table for the linear function y = 3x. a = b = c =
Answers: 2
Mathematics, 22.06.2019 03:00, PearlJam5492
What is the answer to question 11? will give extra points! include a explanation (reasonable) for you : )
Answers: 2
Do you know the correct answer?
The scatter plot and table show the number of grapes and blueberries in 10 fruit baskets.
Questions in other subjects:


