

Mathematics, 10.10.2019 00:40, Courtneymorris19
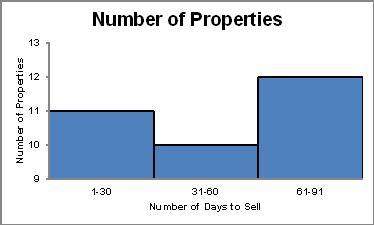
The histogram below shows the number of properties in a town that sold within certain time periods.
why might the graph be considered misleading?
the scales on the x- and y-axes are unequal.
the interval on the x-axis is too large for the data set.
the scale on the y-axis misrepresents the difference in the heights of the bars.
the interval on the y-axis is too large for the data set.

Answers: 3


Other questions on the subject: Mathematics
Mathematics, 21.06.2019 15:00, jonesromari
What are the constants in this expression? -10.6+9/10+2/5m-2.4n+3m
Answers: 3
Mathematics, 21.06.2019 19:10, dylancasebere
What is the quotient of m^6/5 ÷ 5/m^2? assume m does not equal pl
Answers: 1
Mathematics, 21.06.2019 20:30, ElegantEmerald
A. plot the data for the functions f(x) and g(x) on a grid and connect the points. x -2 -1 0 1 2 f(x) 1/9 1/3 1 3 9 x -2 -1 0 1 2 g(x) -4 -2 0 2 4 b. which function could be described as exponential and which as linear? explain. c. if the functions continue with the same pattern, will the function values ever be equal? if so, give estimates for the value of x that will make the function values equals. if not, explain why the function values will never be equal.
Answers: 3
Do you know the correct answer?
The histogram below shows the number of properties in a town that sold within certain time periods....
Questions in other subjects:


Physics, 01.12.2021 21:50

Computers and Technology, 01.12.2021 21:50


Mathematics, 01.12.2021 21:50

Geography, 01.12.2021 21:50
Business, 01.12.2021 21:50


