
![\begin{array}{c|c||lc}\underline{x}&\underline{f}&\underline{f\div 200}&\underline{\text{Probability Distribution}}\\1&20&20\div200=&0.10\\2&120&120\div 200=&0.60\\3&40&40\div 200=&0.20\\4&20&20\div 200=&0.10\end{array}\right]](/tpl/images/0276/3652/4298d.png)


Correct answer only !
the frequency table was made using a deck of cards in which each...

Mathematics, 30.09.2019 11:30, alasia559
Correct answer only !
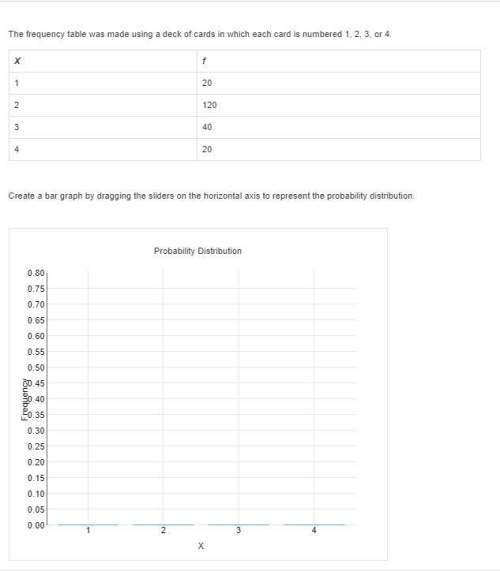
the frequency table was made using a deck of cards in which each card is numbered 1, 2, 3, or 4.
create a bar graph by dragging the sliders on the horizontal axis to represent the probability distribution.

Answers: 1
Other questions on the subject: Mathematics
Do you know the correct answer?
Questions in other subjects:

Business, 07.10.2021 14:00

Mathematics, 07.10.2021 14:00

Biology, 07.10.2021 14:00

Arts, 07.10.2021 14:00

Social Studies, 07.10.2021 14:00

Chemistry, 07.10.2021 14:00
Biology, 07.10.2021 14:00


