

Mathematics, 16.01.2020 00:31, kathleen1010
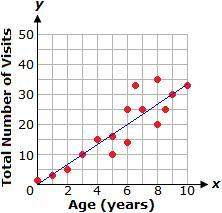
The graph below shows a scatter plot and the line of best fit relating the ages of children and the total number of times they have visited the doctor.
use the line of best fit to estimate the age of a child who has visited the doctor 40 times.
a. 14 years old
b. 13 years old
c. 12 years old
d. 11 years old

Answers: 2
 .... (1)


Other questions on the subject: Mathematics
Mathematics, 21.06.2019 22:30, chrisdelreal86
Ron has 8 caps and 4 of his caps are blue. thes rest of his cap are red. how many of ron's caps are red
Answers: 1
Mathematics, 21.06.2019 23:30, kreshnikolloma
Which of these angles are complementary? a. 45o and 45o b. 63o and 117o c. 45o and 135o d. 90o and 45o
Answers: 1
Mathematics, 22.06.2019 00:00, jetskiinbunny31
The statements below can be used to prove that the triangles are similar. ? △abc ~ △xyz by the sss similarity theorem. which mathematical statement is missing? ∠b ≅ ∠y ∠b ≅ ∠z
Answers: 2
Do you know the correct answer?
The graph below shows a scatter plot and the line of best fit relating the ages of children and the...
Questions in other subjects:

Geography, 26.03.2021 16:20


Biology, 26.03.2021 16:20


Mathematics, 26.03.2021 16:20

Mathematics, 26.03.2021 16:20


