


Match the tiles to the correct boxes to complete the pairs.
based on the diagram, match...

Mathematics, 01.12.2019 23:31, jamielytle
Match the tiles to the correct boxes to complete the pairs.
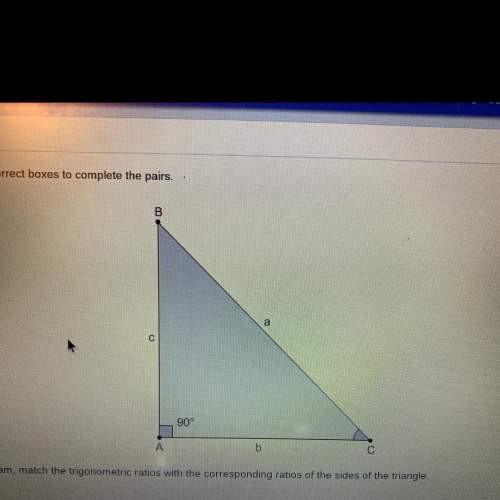
based on the diagram, match the trigonometric ratios with the corresponding ratios of the sides of the triangle.
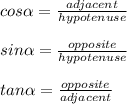
1. cosb
2. tanc
3. sinb
4. tanb
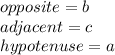
a) c/b
b) b/a
c) b/c
d) c/a
random answers will be reported!

Answers: 1
Other questions on the subject: Mathematics
Mathematics, 21.06.2019 22:20, skyhighozzie
(b) suppose that consolidated power decides to use a level of significance of α = .05, and suppose a random sample of 100 temperature readings is obtained. if the sample mean of the 100 temperature readings is x⎯⎯ = 60.990, test h0 versus ha and determine whether the power plant should be shut down and the cooling system repaired. perform the hypothesis test by using a critical value and a p-value. assume σ = 5. (round your z to 2 decimal places and p-value to 4 decimal places.)
Answers: 2
Mathematics, 21.06.2019 22:30, nane718
According to the 2008 u. s. census, california had a population of approximately 4 × 10^7 people and florida had a population of approximately 2 × 10^7 people. which of the following is true? a. the population of california was approximately two times the population of florida. b. the population of florida was approximately twenty times the population of california. c. the population of florida was approximately two times the population of california. d. the population of california was approximately twenty times the population of florida.
Answers: 1
Mathematics, 22.06.2019 01:40, jraemier5480
Afamily has two cars. the first car has a fuel efficiency of 25 miles per gallon of gas and the second has a fuel efficiency of 15 miles per gallon of gas. during one particular week, the two cars went a combined total of 1025 miles, for a total gas consumption of 55 gallons. how many gallons were consumed by each of the two cars that week?
Answers: 1
Mathematics, 22.06.2019 02:30, HolaConcheeDaBrycee
Six random samples were taken each year for three years. the table shows the inferred population for each type of fish for each year.
Answers: 1
Do you know the correct answer?
Questions in other subjects:


English, 28.08.2019 20:10


