

Mathematics, 15.10.2019 04:30, 24wilsleaann
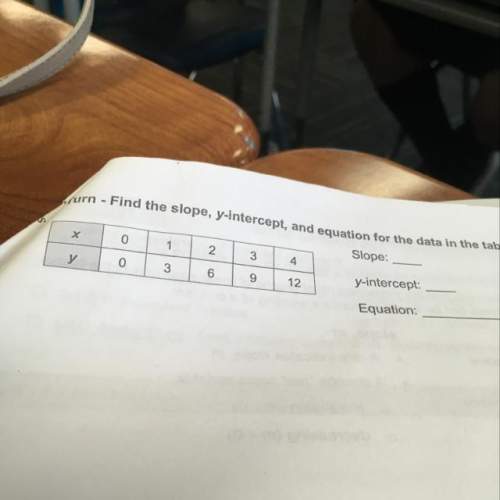
Find the slope y-intercept and equation for the data in the table and in the graph can someone me

Answers: 2


Other questions on the subject: Mathematics
Mathematics, 21.06.2019 16:00, jeff7259
The scatter plot graph shows the average annual income for a certain profession based on the number of years of experience which of the following is most likely to be the equation of the trend line for this set of data? a. i=5350e +37100 b. i=5350e-37100 c. i=5350e d. e=5350e+37100
Answers: 1
Mathematics, 21.06.2019 17:00, TheRunningPotatoe245
Asif spent $745.10 on 13 new file cabinets for his office. small file cabinets cost $43.50 and large file cabinets cost $65.95. write and solve a system of equations to find the number of small cabinets and large cabinets he purchased. determine if each statement is true or false. 1. he purchased 5 small cabinets. true or false 2. he purchased 7 large cabinets. true or false 3. he spent $527.60 on large cabinets. true or false
Answers: 2
Mathematics, 21.06.2019 22:00, taliyahjhonson1
The birth weights of newborn babies in the unites states follow in a normal distrubution with a mean of 3.4 kg and standard deviation of 0.6 kg. reaserches interested in studying how. children gain weights decide to take random samples of 100 newborn babies and calculate the sample mean birth weights for each sample
Answers: 1
Do you know the correct answer?
Find the slope y-intercept and equation for the data in the table and in the graph can someone me<...
Questions in other subjects:
Mathematics, 14.07.2019 20:30
Mathematics, 14.07.2019 20:30

English, 14.07.2019 20:30
Mathematics, 14.07.2019 20:30


