


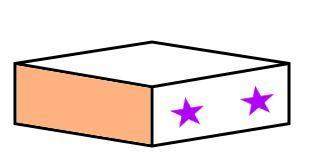
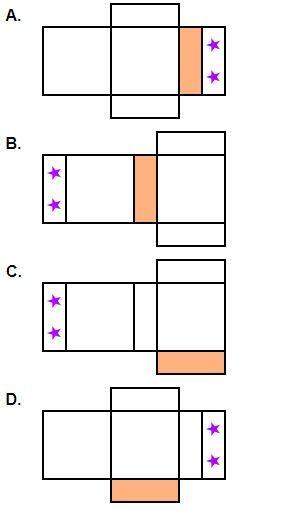
Which net folds to make the prism shown?
2nd picture has the letter choice
<...

Mathematics, 28.11.2019 13:31, ElizabethF
Which net folds to make the prism shown?
2nd picture has the letter choice

Answers: 1
Other questions on the subject: Mathematics
Mathematics, 21.06.2019 12:30, mommyp1973
How can you solve an equation with a variable on both sides? complete the explanation. you can solve the equation by using *(blank)* operations to get the variable terms on one side of the equal sign and the constant terms on the *(blank)* side. then *(blank)* both sides by the coefficient of the resulting variable term.
Answers: 2
Mathematics, 21.06.2019 20:30, brandisouthern9
Awasher and a dryer cost $701 combined. the washer costs $51 more than the dryer. what is the cost of the dryer?
Answers: 1
Mathematics, 21.06.2019 23:00, janeou17xn
The equation shown below represents function f. f(x)= -2x+5 the graph shown below represents function g. which of the following statements is true? a. over the interval [2, 4], the average rate of change of f is the same as the average rate of change of g. the y-intercept of function f is less than the y-intercept of function g. b. over the interval [2, 4], the average rate of change of f is greater than the average rate of change of g. the y-intercept of function f is greater than the y-intercept of function g. c. over the interval [2, 4], the average rate of change of f is the same as the average rate of change of g. the y-intercept of function f is greater than the y-intercept of function g. d. over the interval [2, 4], the average rate of change of f is less than the average rate of change of g. the y-intercept of function f is the same as the y-intercept of function g.
Answers: 1
Mathematics, 21.06.2019 23:00, kj44
Each of the following data sets has a mean of x = 10. (i) 8 9 10 11 12 (ii) 7 9 10 11 13 (iii) 7 8 10 12 13 (a) without doing any computations, order the data sets according to increasing value of standard deviations. (i), (iii), (ii) (ii), (i), (iii) (iii), (i), (ii) (iii), (ii), (i) (i), (ii), (iii) (ii), (iii), (i) (b) why do you expect the difference in standard deviations between data sets (i) and (ii) to be greater than the difference in standard deviations between data sets (ii) and (iii)? hint: consider how much the data in the respective sets differ from the mean. the data change between data sets (i) and (ii) increased the squared difference îł(x - x)2 by more than data sets (ii) and (iii). the data change between data sets (ii) and (iii) increased the squared difference îł(x - x)2 by more than data sets (i) and (ii). the data change between data sets (i) and (ii) decreased the squared difference îł(x - x)2 by more than data sets (ii) and (iii). none of the above
Answers: 2
Do you know the correct answer?
Questions in other subjects:

Mathematics, 21.01.2020 01:31
Mathematics, 21.01.2020 01:31
Mathematics, 21.01.2020 01:31

Business, 21.01.2020 01:31


