

Mathematics, 14.10.2019 15:30, 19youngr
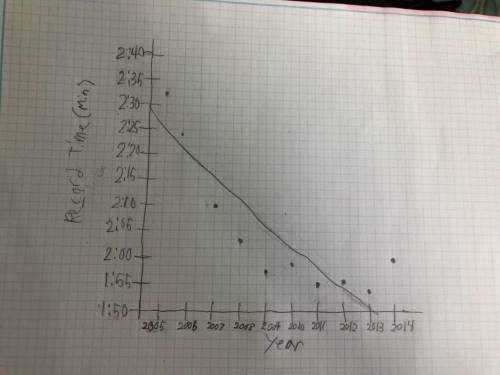
An olympic swimmer competes in the same events during each long course swim season. a swimmer currently competing on the united states women’s olympic swim team, will swim her best events each year with the hope of continuous improvement. the following table is a record of the swimmer’s best times for the 100 meter freestyle event, measured in long course meters.
long course
season recorded
best time
2005 2: 33.42
2006 2: 24.81
2007 2: 10.93
2008 2: 03.45
2009 1: 58.67
2010 1: 59.17
2011 1: 55.06
2012 1: 55.82
2013 1: 54.81
2014 2: 00.03
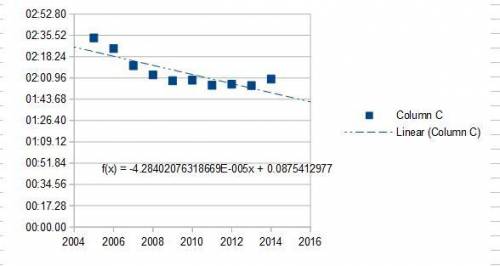
create a scatter plot representing the data displayed in the table.
use the scatter plot to determine whether there is positive, negative or no correlation between the data values.
write a conclusion statement regarding the data and the rate of change present in the line of best fit. do not actually calculate the slope or write the equation for the line of best fit.

Answers: 3


Other questions on the subject: Mathematics
Mathematics, 21.06.2019 22:00, connorhanratty6487
James is playing his favorite game at the arcade. after playing the game 33 times, he has 88 tokens remaining. he initially had 2020 tokens, and the game costs the same number of tokens each time. the number tt of tokens james has is a function of gg, the number of games he plays
Answers: 1
Mathematics, 22.06.2019 00:00, boxergirl2062
Two consecutive negative integers have a product of 30. what are the integers?
Answers: 2
Do you know the correct answer?
An olympic swimmer competes in the same events during each long course swim season. a swimmer curren...
Questions in other subjects:
Mathematics, 25.03.2020 07:00


Mathematics, 25.03.2020 07:00
Mathematics, 25.03.2020 07:00

English, 25.03.2020 07:00


