

Mathematics, 21.09.2019 16:30, eduardo60
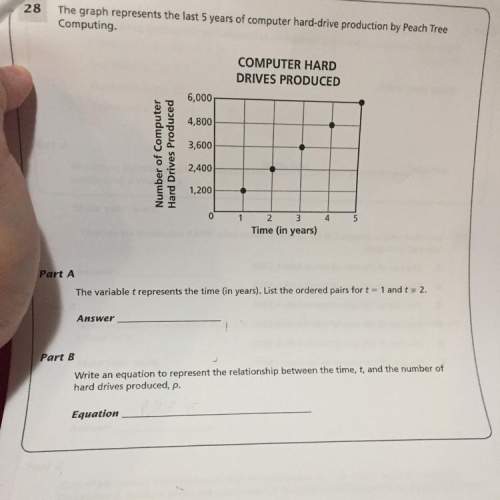
The graph represents the last 5 years of computer hard-drive production by peach tree computing
part a: the variable t represents the time (in years).list the ordered pairs for t=1 and t=2.
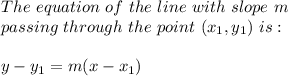
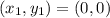
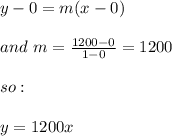
part b: write an equation to represent the relationship between the time, t, and the number of hard drives produced, p.

Answers: 1
 represents the time (in years), so we need to list the ordered pairs for
  . An ordered pair are two numbers written in a certain order usually in parentheses like
  . Here in this problem
  will represent the time
  will represent the Number of Computer Hard Drive Produced
  , thus:
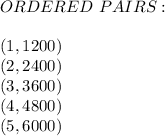


Other questions on the subject: Mathematics
Mathematics, 21.06.2019 20:30, cogger9348
3.17 scores on stats final. below are final exam scores of 20 introductory statistics students. 1 2 3 4 5 6 7 8 9 10 11 12 13 14 15 16 17 18 19 20 57, 66, 69, 71, 72, 73, 74, 77, 78, 78, 79, 79, 81, 81, 82, 83, 83, 88, 89, 94 (a) the mean score is 77.7 points. with a standard deviation of 8.44 points. use this information to determine if the scores approximately follow the 68-95-99.7% rule. (b) do these data appear to follow a normal distribution? explain your reasoning using the graphs provided below.
Answers: 1
Mathematics, 21.06.2019 22:30, 24lfoster
Ascientist places 24 cells in a petri dish. she knows the cells grow at an exponential rate, doubling in number every hour. how long will it take (in hours) for there to be 1100 cells in the dish? time to 1100 cells: 5.51832530 hours how long will it take to reach 110 cells? time to 110 cells : 2.1963972 hours what is the average rate of change in the number of cells between 9 hours and 11 hours? average rate of change: cells per hour what is the instantaneous rate of change after 7 hours? instantaneous rate of change: cells per hour note: you can earn partial credit on this problem.
Answers: 1
Mathematics, 21.06.2019 23:30, memorybuxton
Atown has a population of 12000 and grows at 3.5% every year. what will be the population after 7 years, to the nearest whole number?
Answers: 3
Do you know the correct answer?
The graph represents the last 5 years of computer hard-drive production by peach tree computing
Questions in other subjects:

Mathematics, 18.03.2022 20:00


English, 18.03.2022 20:10


