

Mathematics, 20.10.2019 05:00, dakotacsey03
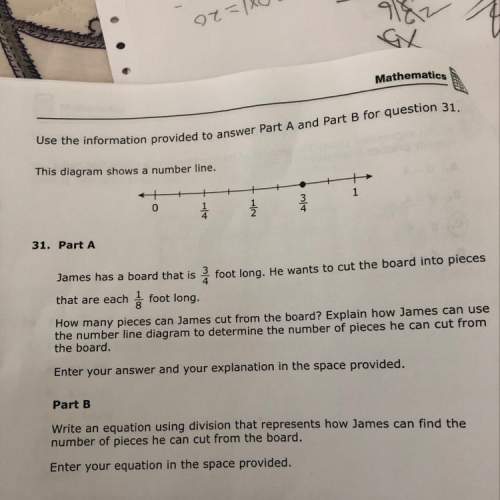
Use the information provided to answer part a and part b for question 31. this diagram shows a number line
part a
james has a board that is 3/4 foot long. he wants to cut the board into pieces that are each 1/8 foot long.
how many pieces can james cut from the board? explain how janes can use the number line digram the determination the number of pieces he can cut from the board.
part b
when a equation using the version that represents how james can find the number of pieces he can cut from the board.

Answers: 1


Similar questions
Mathematics, 14.07.2019 02:00, Ayalij
Answers: 1
Mathematics, 02.08.2019 23:10, Rosy1234Locks
Answers: 1
Mathematics, 02.08.2019 23:10, nathanbrockdac
Answers: 1
Do you know the correct answer?
Use the information provided to answer part a and part b for question 31. this diagram shows a numbe...
Questions in other subjects:
Mathematics, 16.12.2019 03:31


History, 16.12.2019 03:31
Mathematics, 16.12.2019 03:31


