A
Step-by-step explanation:
By definition, all sides of a regular polygon are equal in length. If you know the length of one of the sides, the area is given by the formula:
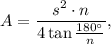
where s is the side length, n is the number of sides.
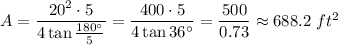
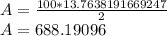
In your case, s=20 ft, n=5,so