
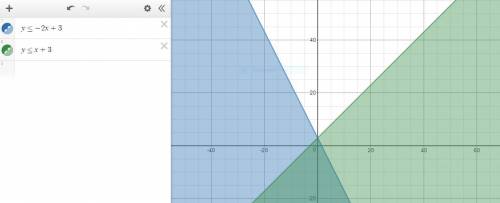


The graph below represents which system of inequalities?
a) y ≤ −2x + 3
y ≤ x +...

Mathematics, 27.09.2019 07:30, montgomeryaevans
The graph below represents which system of inequalities?
a) y ≤ −2x + 3
y ≤ x + 3
b) y ≥ −2x + 3
y ≥ x + 3
c) y ≤ −3x + 2
y ≤ −x + 2
d) y > −2x + 3
y > x + 3

Answers: 2
Other questions on the subject: Mathematics
Mathematics, 21.06.2019 16:30, elysabrina6697
Write each fraction as an equivalent fraction with a denominator of 120then write the original fractions in order from samllest to largest
Answers: 3
Mathematics, 21.06.2019 20:30, daeshawnc14
What’s -11-33k and factor each expression completely
Answers: 2
Do you know the correct answer?
Questions in other subjects:
Mathematics, 26.10.2020 20:40


Mathematics, 26.10.2020 20:40

Mathematics, 26.10.2020 20:40


