

Mathematics, 30.11.2019 09:31, GrinReaperXll
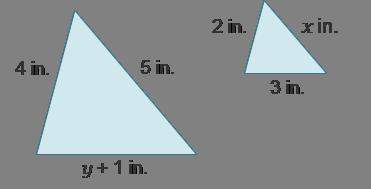
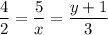
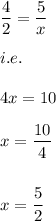
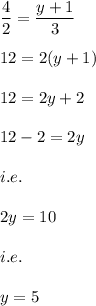
These two figures are the image and pre-image of a dilation. find the length of the missing sides.

Answers: 3


Other questions on the subject: Mathematics
Mathematics, 21.06.2019 18:30, jorozco3209
Haruka hiked several kilometers in the morning. she hiked only 66 kilometers in the afternoon, which was 25% less than she had hiked in the morning. how many kilometers did haruka hike in all?
Answers: 1
Mathematics, 22.06.2019 01:30, cpulls189
Cherie works in retail and her weekly salary includes commission for the amount she sells. the equation s=400+0.15c models the relation between her weekly salary, s, in dollars and the amount of her sales, c, in dollars. interpret the slope of the equation.
Answers: 3
Mathematics, 22.06.2019 02:30, misk980
Atrain traveled for 1.5 hours to the first station, stopped for 30 minutes, then traveled for 4 hours to the final station where it stopped for 1 hour. the total distance traveled is a function of time. which graph most accurately represents this scenario? a graph is shown with the x-axis labeled time (in hours) and the y-axis labeled total distance (in miles). the line begins at the origin and moves upward for 1.5 hours. the line then continues upward at a slow rate until 2 hours. from 2 to 6 hours, the line continues quickly upward. from 6 to 7 hours, it moves downward until it touches the x-axis a graph is shown with the axis labeled time (in hours) and the y axis labeled total distance (in miles). a line is shown beginning at the origin. the line moves upward until 1.5 hours, then is a horizontal line until 2 hours. the line moves quickly upward again until 6 hours, and then is horizontal until 7 hours a graph is shown with the axis labeled time (in hours) and the y-axis labeled total distance (in miles). the line begins at the y-axis where y equals 125. it is horizontal until 1.5 hours, then moves downward until 2 hours where it touches the x-axis. the line moves upward until 6 hours and then moves downward until 7 hours where it touches the x-axis a graph is shown with the axis labeled time (in hours) and the y-axis labeled total distance (in miles). the line begins at y equals 125 and is horizontal for 1.5 hours. the line moves downward until 2 hours, then back up until 5.5 hours. the line is horizontal from 5.5 to 7 hours
Answers: 1
Do you know the correct answer?
These two figures are the image and pre-image of a dilation. find the length of the missing sides. <...
Questions in other subjects:


History, 09.01.2020 07:31


Mathematics, 09.01.2020 07:31
Chemistry, 09.01.2020 07:31


