


Can someone me? !
the table shows the rainfall, in inches, in the month of july for t...

Mathematics, 05.01.2020 05:31, ballin4534
Can someone me? !
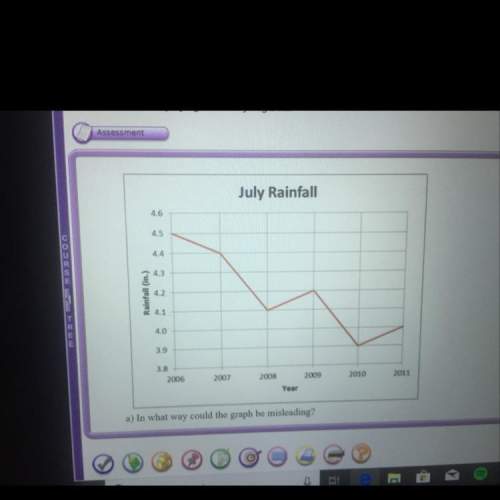
the table shows the rainfall, in inches, in the month of july for the years 2006-2011
2006=4.5
2007=4.4
2008=4.1
2009=4.2
2010=3.9
2011=4.0
alex used the graph below
(graph at the top)
a) in what way could this graph be misleading
b) how could you redraw the graph so that it is less misleading

Answers: 3
Other questions on the subject: Mathematics
Mathematics, 21.06.2019 14:10, uhhgray
Students are given 3 minutes for each multiple-choice question and 5 minutes for each free-response question on a test. there are 15 questions on the test, and students are given 51 minutes to take it. how many multiple-choice questions are on the test?
Answers: 1
Mathematics, 21.06.2019 18:50, garrettcameron12
Given: pqrs is a parallelogram prove: pr and qs bisect each other at t
Answers: 1
Mathematics, 21.06.2019 19:00, issaaamiaaa15
You got a job selling magazines door-to-door. you are paid $100 per day plus $1.50 for each magazine you sell. which recursive formula models this situation?
Answers: 1
Do you know the correct answer?
Questions in other subjects:
Mathematics, 05.10.2021 19:00


