Mathematics, 14.10.2019 10:00, coolkason
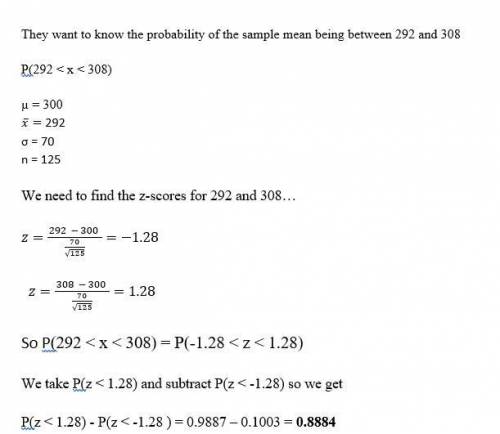
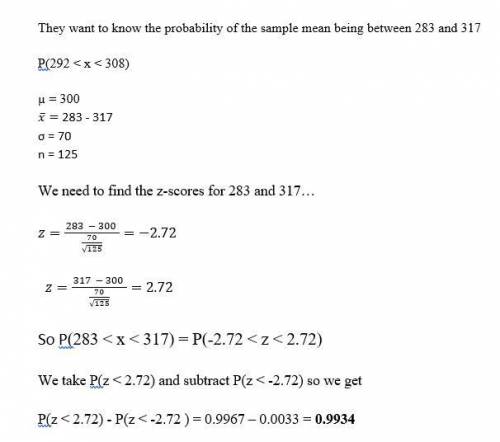
Apopulation has a mean of 300 and a standard deviation of 70. suppose a sample of size 125 is selected and is used to estimate . use z-table. what is the probability that the sample mean will be within +/- 8 of the population mean (to 4 decimals)? (round z value in intermediate calculations to 2 decimal places.) what is the probability that the sample mean will be within +/- 17 of the population mean (to 4 decimals)? (round z value in intermediate calculations to 2 decimal places.)

Answers: 1
Other questions on the subject: Mathematics

Mathematics, 21.06.2019 18:00, stephanielynch
Last year, a state university received 3,560 applications from boys. of those applications, 35 percent were from boys who lived in other states. part a)how many applications did the university receive from boys who lived in other states? part b)applications to the university from boys represented 40percent of all applications. how many applications did the university receive in all? i don't how to do part b so me and plz tell how you got your answer
Answers: 1


Mathematics, 21.06.2019 21:30, shymitch32
Create a graph for the demand for starfish using the following data table: quantity/price of starfish quantity (x axis) of starfish in dozens price (y axis) of starfish per dozen 0 8 2 6 3 5 5 2 7 1 9 0 is the relationship between the price of starfish and the quantity demanded inverse or direct? why? how many dozens of starfish are demanded at a price of five? calculate the slope of the line between the prices of 6 (quantity of 2) and 1 (quantity of 7) per dozen. describe the line when there is a direct relationship between price and quantity.
Answers: 3

Mathematics, 21.06.2019 23:30, bbby2
Aprisoner is trapped in a cell containing three doors. the first door leads to a tunnel that returns him to his cell after two days of travel. the second leads to a tunnel that returns him to his cell after three days of travel. the third door leads immediately to freedom. (a) assuming that the prisoner will always select doors 1, 2 and 3 with probabili- ties 0.5,0.3,0.2 (respectively), what is the expected number of days until he reaches freedom? (b) assuming that the prisoner is always equally likely to choose among those doors that he has not used, what is the expected number of days until he reaches freedom? (in this version, if the prisoner initially tries door 1, for example, then when he returns to the cell, he will now select only from doors 2 and 3.) (c) for parts (a) and (b), find the variance of the number of days until the prisoner reaches freedom. hint for part (b): define ni to be the number of additional days the prisoner spends after initially choosing door i and returning to his cell.
Answers: 1
Do you know the correct answer?
Apopulation has a mean of 300 and a standard deviation of 70. suppose a sample of size 125 is select...
Questions in other subjects:

Mathematics, 12.02.2020 02:19

Mathematics, 12.02.2020 02:19


Physics, 12.02.2020 02:19


