

Mathematics, 16.01.2020 08:31, DesperatforanA
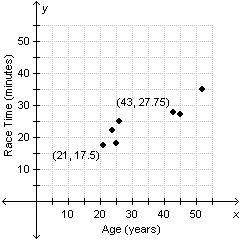
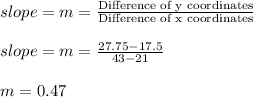
The scatterplot shows the ages and finishing times of seven men who ran a charity 5k run. use the labeled points to create a linear model that predicts the race time (y) of a man of any age (x). which equation represents this linear model?
y=o.47x+7.72
y=0.47x+29.15
y=2.146x-27.57
y=2.146x-2.07

Answers: 2


Other questions on the subject: Mathematics
Mathematics, 21.06.2019 17:50, AdanNava699
Find the cosine function that is represented in the graph.
Answers: 1
Mathematics, 21.06.2019 18:00, lclaudettecarte3550
Find the number of real number solutions for the equation. x2 + 5x + 7 = 0 0 cannot be determined 1 2
Answers: 2
Mathematics, 21.06.2019 18:30, mstrish71oteauw
Two angles are complementary. the large angle is 36 more than the smaller angle. what is the measure of the large angle?
Answers: 1
Mathematics, 21.06.2019 19:00, JvGaming2001
The probability that you roll a two on a six-sided die is 1 6 16 . if you roll the die 60 times, how many twos can you expect to roll
Answers: 1
Do you know the correct answer?
The scatterplot shows the ages and finishing times of seven men who ran a charity 5k run. use the la...
Questions in other subjects:


Mathematics, 26.05.2021 18:30
Mathematics, 26.05.2021 18:30

Advanced Placement (AP), 26.05.2021 18:30


