

Mathematics, 01.10.2019 03:30, sindy35111
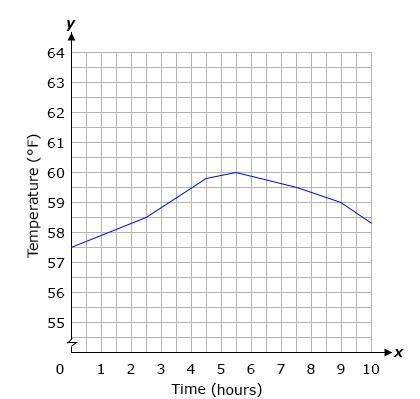
The temperature in a city was recorded over a ten-hour period. the graph below shows the relationship between the temperature and the number of hours.
which statement best interprets information provided by the graph?
a. the temperature in the city increased for some time and decreased for some time.
b. the temperature remained constant for a while.
c. the temperature in the city increased throughout the period.
d. the temperature in the city increased at a constant rate for the entire time.

Answers: 1


Other questions on the subject: Mathematics
Mathematics, 21.06.2019 16:30, chloesmolinski0909
Solve the equation w^3 = 1,000 i honestly dont know how to punch this into a calculator pls
Answers: 1
Mathematics, 21.06.2019 18:00, sophiamoser
Julius sold five times as many computers as sam sold last year. in total, they sold 78 computers. how many computers did julius sell?
Answers: 1
Mathematics, 21.06.2019 18:10, chyyy3
The means and mean absolute deviations of the individual times of members on two 4x400-meter relay track teams are shown in the table below. means and mean absolute deviations of individual times of members of 4x400-meter relay track teams team a team b mean 59.32 s 59.1 s mean absolute deviation 1.5 s 245 what percent of team b's mean absolute deviation is the difference in the means? 9% 15% 25% 65%
Answers: 2
Do you know the correct answer?
The temperature in a city was recorded over a ten-hour period. the graph below shows the relationshi...
Questions in other subjects:

Chemistry, 27.10.2020 21:50
Mathematics, 27.10.2020 21:50

Social Studies, 27.10.2020 21:50
Mathematics, 27.10.2020 21:50
Mathematics, 27.10.2020 21:50
Chemistry, 27.10.2020 21:50

History, 27.10.2020 21:50


