

Mathematics, 23.09.2019 15:20, briana21092005
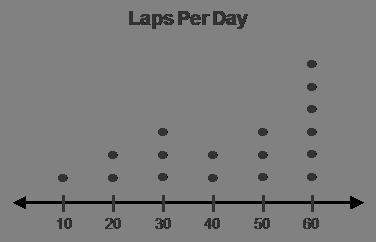
The dot plot shows the number of laps per day a swim team completes. luca described the data as having a spread from 10 to 60, a gap at 40, and a peak at 60. where did luca make an error?
a. luca did not make an error.
b. the spread is from 1 to 6.
c. there is no gap in this data set.
d. the peak is at 10.

Answers: 2


Other questions on the subject: Mathematics
Mathematics, 21.06.2019 16:30, jweldene12
Why do interests rates on loans to be lower in a weak economy than in a strong one
Answers: 2
Mathematics, 21.06.2019 17:00, danjan9084
Aplane flies around trip to philadelphia it flies to philadelphia at 220 miles per hour and back home with a tailwind at 280 miles per hour if the total trip takes 6.5 hours how many miles does the plane fly round trip
Answers: 1
Mathematics, 21.06.2019 19:00, 592400014353
The test scores of 32 students are listed below. construct a boxplot for the data set and include the values of the 5-number summary. 32 37 41 44 46 48 53 55 57 57 59 63 65 66 68 69 70 71 74 74 75 77 78 79 81 82 83 86 89 92 95 99
Answers: 1
Mathematics, 22.06.2019 00:00, michneidredep7427
Abowl contained 270 starbursts of all different colors. if the probability of picking a yellow is 1/9, then how many yellow starbursts are in the bowl ? ?
Answers: 1
Do you know the correct answer?
The dot plot shows the number of laps per day a swim team completes. luca described the data as havi...
Questions in other subjects:

Social Studies, 10.04.2020 20:09

History, 10.04.2020 20:09

Computers and Technology, 10.04.2020 20:09


Mathematics, 10.04.2020 20:10


