

Mathematics, 24.09.2019 21:30, atran4820
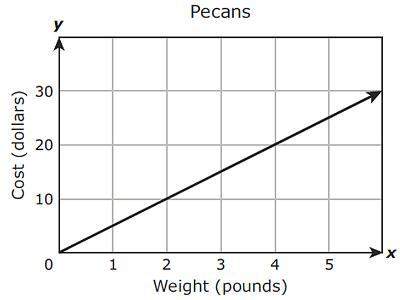
The graph above shows the relationship between the cost of some pecans and the weight of the pecans in pounds.
which function best represents the relationship shown in the graph?
a) y = 5x
b) y = 1/5x
c) y = 2x
d) y = 1/2x

Answers: 1


Other questions on the subject: Mathematics
Mathematics, 22.06.2019 04:20, barbar12345
Is an altitude in triangle abc. which statements are true? check all that apply. δabc δbxc δaxc ~ δcxb δbcx δacx δacb ~ δaxc δcxa δcba
Answers: 2
Do you know the correct answer?
The graph above shows the relationship between the cost of some pecans and the weight of the pecans...
Questions in other subjects:

Arts, 03.12.2020 23:50

Biology, 03.12.2020 23:50

Mathematics, 03.12.2020 23:50


History, 03.12.2020 23:50


