


30 points for a legit answer! hurry !
the graph below plots the values of y for differ...

Mathematics, 18.10.2019 04:50, idunno456
30 points for a legit answer! hurry !
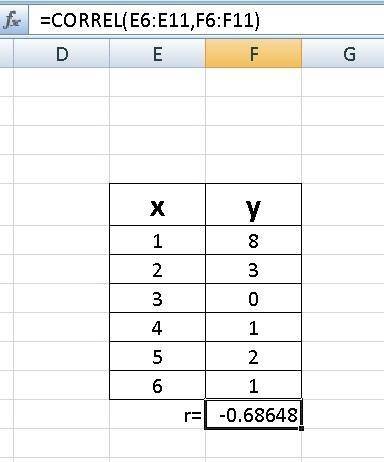
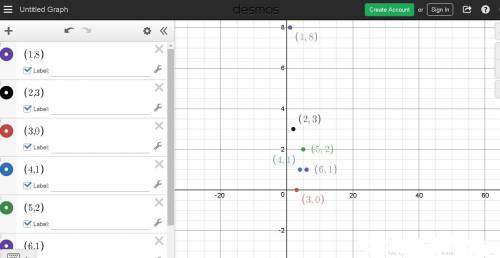
the graph below plots the values of y for different values of x: plot the ordered pairs 1, 8 and 2, 3 and 3, 0 and 4, 1 and 5, 2 and 6,1
image is attached below (if its not, reload the page)
what is the correlation coefficient for the data plotted? −0.9 −0.6 0.6 0.9

Answers: 3
Similar questions
Mathematics, 24.10.2019 11:43, radusevciuc7719
Answers: 2
Do you know the correct answer?
Questions in other subjects:


Biology, 20.01.2022 04:30


English, 20.01.2022 04:30
Mathematics, 20.01.2022 04:30

Chemistry, 20.01.2022 04:30


