


Asap
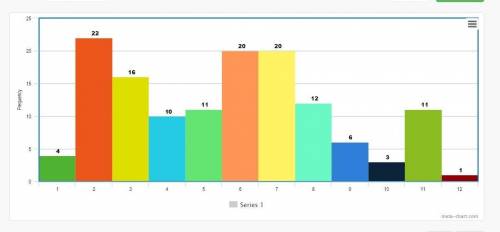
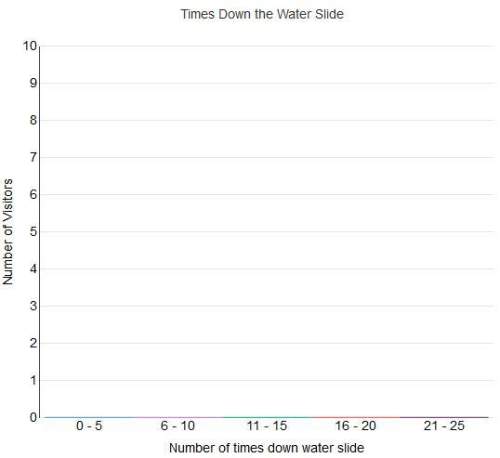
create a histogram of this data.
to create a histogram, hover over each a...

Mathematics, 31.01.2020 22:54, medusa36
Asap
create a histogram of this data.
to create a histogram, hover over each age range on the x-axis. then click and drag up to plot the data
4, 22, 16, 10, 11, 20, 20, 12, 6, 3, 11, 1

Answers: 2
Other questions on the subject: Mathematics
Mathematics, 20.06.2019 18:04, Uc34758
Here is their argument. given the obtuse angle x, we make a quadrilateral abcd with ∠dab = x, and ∠abc = 90◦, and ad = bc. say the perpendicular bisector to dc meets the perpendicular bisector to ab at p. then pa = pb and pc = pd. so the triangles pad and pbc have equal sides and are congruent. thus ∠pad = ∠pbc. but pab is isosceles, hence ∠pab = ∠pba. subtracting, gives x = ∠pad−∠pab = ∠pbc −∠pba = 90◦. this is a preposterous conclusion – just where is the mistake in the "proof" and why does the argument break down there?
Answers: 2
Mathematics, 21.06.2019 19:00, ashrobbb
The annual snowfall in a town has a mean of 38 inches and a standard deviation of 10 inches. last year there were 63 inches of snow. find the number of standard deviations from the mean that is, rounded to two decimal places. 0.44 standard deviations below the mean 2.50 standard deviations below the mean 0.44 standard deviations above the mean 2.50 standard deviations above the mean
Answers: 3
Mathematics, 21.06.2019 20:30, nosugh
If m∠abc = 70°, what is m∠abd? justify your reasoning. using the addition property of equality, 40 + 70 = 110, so m∠abd = 110°. using the subtraction property of equality, 70 − 30 = 40, so m∠abd = 30°. using the angle addition postulate, 40 + m∠abd = 70. so, m∠abd = 30° using the subtraction property of equality. using the angle addition postulate, 40 + 70 = m∠abd. so, m∠abd = 110° using the addition property of equality.
Answers: 2
Do you know the correct answer?
Questions in other subjects:
Mathematics, 26.06.2020 22:01


