
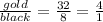


Ashort necklace has 32 gold beads and 8 black beads.
a long necklace has a total of 60 b...

Mathematics, 13.10.2019 03:30, jaureguilol1
Ashort necklace has 32 gold beads and 8 black beads.
a long necklace has a total of 60 beads.
both necklaces have the same ratio of gold beads to black beads.
how many black beads are on the long necklace?

Answers: 2
Other questions on the subject: Mathematics
Mathematics, 21.06.2019 15:10, wanderlay29
Which system of linear inequalities is graphed? can somebody please
Answers: 3
Mathematics, 21.06.2019 16:00, jeff7259
The scatter plot graph shows the average annual income for a certain profession based on the number of years of experience which of the following is most likely to be the equation of the trend line for this set of data? a. i=5350e +37100 b. i=5350e-37100 c. i=5350e d. e=5350e+37100
Answers: 1
Mathematics, 22.06.2019 03:00, dominiqueallen23
Describe how the presence of possible outliers might be identified on the following. (a) histograms gap between the first bar and the rest of bars or between the last bar and the rest of bars large group of bars to the left or right of a gap higher center bar than surrounding bars gap around the center of the histogram higher far left or right bar than surrounding bars (b) dotplots large gap around the center of the data large gap between data on the far left side or the far right side and the rest of the data large groups of data to the left or right of a gap large group of data in the center of the dotplot large group of data on the left or right of the dotplot (c) stem-and-leaf displays several empty stems in the center of the stem-and-leaf display large group of data in stems on one of the far sides of the stem-and-leaf display large group of data near a gap several empty stems after stem including the lowest values or before stem including the highest values large group of data in the center stems (d) box-and-whisker plots data within the fences placed at q1 â’ 1.5(iqr) and at q3 + 1.5(iqr) data beyond the fences placed at q1 â’ 2(iqr) and at q3 + 2(iqr) data within the fences placed at q1 â’ 2(iqr) and at q3 + 2(iqr) data beyond the fences placed at q1 â’ 1.5(iqr) and at q3 + 1.5(iqr) data beyond the fences placed at q1 â’ 1(iqr) and at q3 + 1(iqr)
Answers: 1
Do you know the correct answer?
Questions in other subjects:

History, 20.09.2020 08:01
History, 20.09.2020 08:01

Geography, 20.09.2020 08:01
Mathematics, 20.09.2020 08:01

Mathematics, 20.09.2020 08:01
Mathematics, 20.09.2020 08:01
History, 20.09.2020 08:01

Geography, 20.09.2020 08:01


