


Consider this scatter plot.
(a) how would you characterize the relationship between the hours...

Mathematics, 22.09.2019 19:30, carlinryan
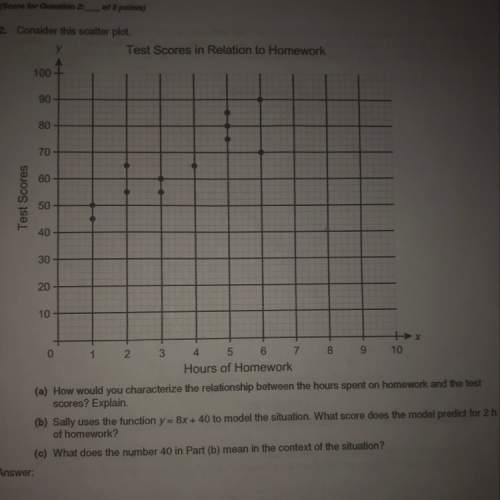
Consider this scatter plot.
(a) how would you characterize the relationship between the hours spent on homework and the test scores? explain.
(b) sally uses the function y = 8x + 40 to model the situation. what score does the model predict for 2 h of homework?
(c) what does the number 40 in part (b) mean in the context of the situation?

Answers: 1
Other questions on the subject: Mathematics
Mathematics, 20.06.2019 18:04, jasonoliva13
The sum of the product of 4 and x and the product of 7 and y is 61. the sum of the product of 12 and x and the product of 21 and y is 61. what are the values of x and y?
Answers: 1
Mathematics, 21.06.2019 15:50, cluchmasters3831
How many zeros does the function f(x)=4x3-x2+1 have
Answers: 1
Mathematics, 21.06.2019 18:30, anishivaturi123
Select the lengths in centimeters that would form a right triangle
Answers: 1
Do you know the correct answer?
Questions in other subjects:


