
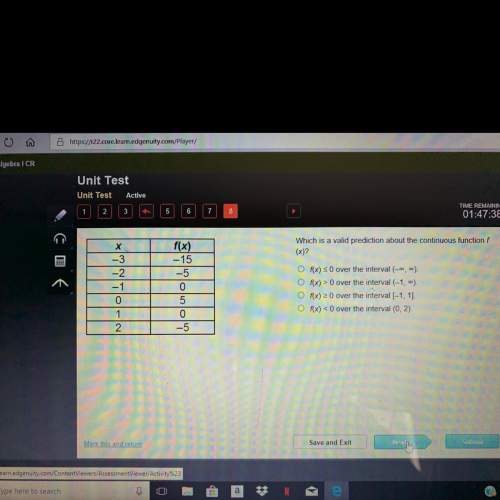


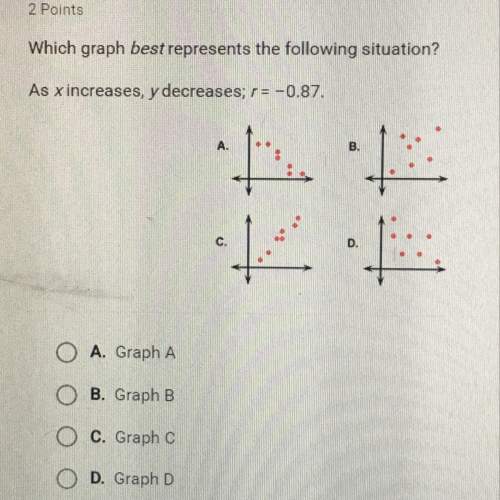
Which graph best represents the following situation? as x increases, y decreases; r=-0.87.
...

Mathematics, 14.01.2020 17:31, krystalhurst97
Which graph best represents the following situation? as x increases, y decreases; r=-0.87.

Answers: 3
Other questions on the subject: Mathematics
Mathematics, 21.06.2019 15:30, yhbgvfcd6677
Fabian harvests 10 pounds of tomatoes from his garden. he needs 225 pounds to make a batch of soup. if he sets aside 2.8 pounds of tomatoes to make spaghetti sauce, how many batches of soup can fabian make?
Answers: 2
Mathematics, 21.06.2019 19:00, hiddenauthors436
Ineed to know the answer to this algebra question.
Answers: 1
Mathematics, 21.06.2019 20:30, stgitskaysie9028
Write an expression that represent sarah’s total pay last week. represent her hourly wage with w monday 5 tuesday 3 wednesday 0 noah hours wednesday 8 only with w wage did noah and sarah earn the same amount last week?
Answers: 3
Do you know the correct answer?
Questions in other subjects:


