
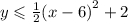
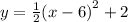

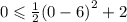

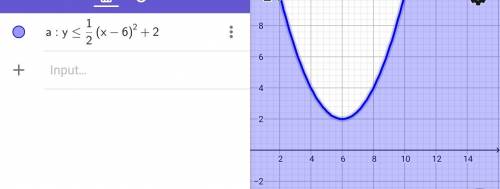


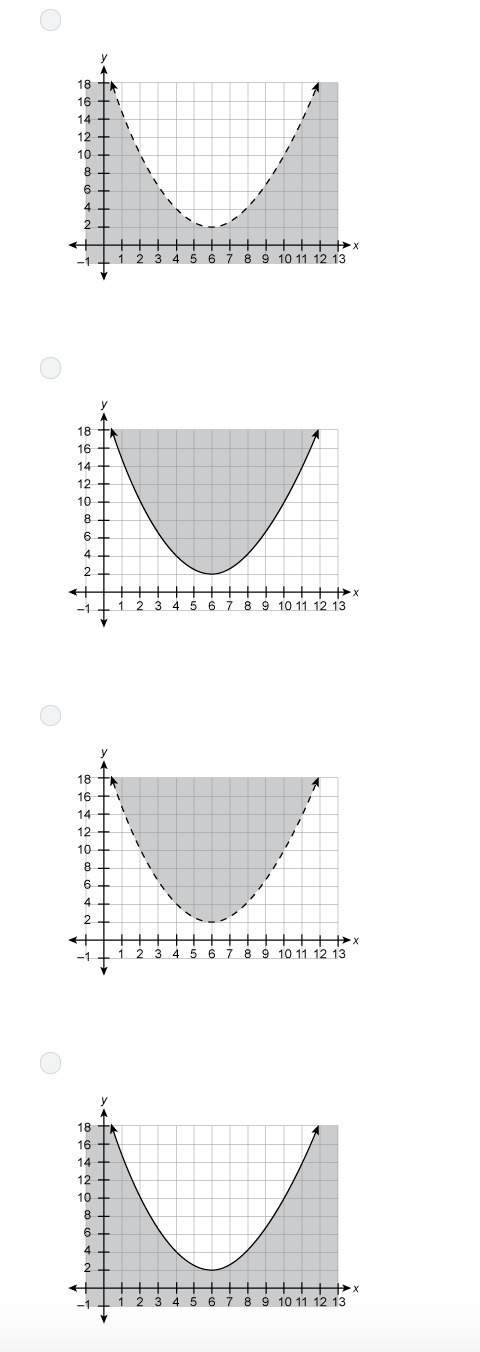
Which graph is the graph of the following inequality? y ≤ 1/2 (x-6)^2 + 2
...

Mathematics, 23.06.2019 04:00, maggiemae3645
Which graph is the graph of the following inequality? y ≤ 1/2 (x-6)^2 + 2

Answers: 2
Other questions on the subject: Mathematics
Mathematics, 20.06.2019 18:04, taryn3
George is folding a piece of paper to make an origami figure. each time he folds the paper, the thickness of the paper is doubled. the paper starts out flat, with a thickness of 1 millimeter. a. write a list of six ordered pairs showing the output as the thickness of the paper when the input is the number of times it is folded. explain how you came up with your ordered pairs. b. is this relation a function? explain why or why not using the ordered pairs you came up with in part a.
Answers: 1
Mathematics, 21.06.2019 18:00, cashhd1212
The given dot plot represents the average daily temperatures, in degrees fahrenheit, recorded in a town during the first 15 days of september. if the dot plot is converted to a box plot, the first quartile would be drawn at __ , and the third quartile would be drawn at __ link to graph: .
Answers: 1
Mathematics, 21.06.2019 20:00, lavorisjonesjr1
Worth 30 points! in this diagram, both polygons are regular. what is the value, in degrees, of the sum of the measures of angles abc and abd?
Answers: 2
Do you know the correct answer?
Questions in other subjects:
Mathematics, 12.09.2021 04:10

Mathematics, 12.09.2021 04:10
Mathematics, 12.09.2021 04:10


