

Mathematics, 23.06.2019 05:00, tdyson3p6xvtu
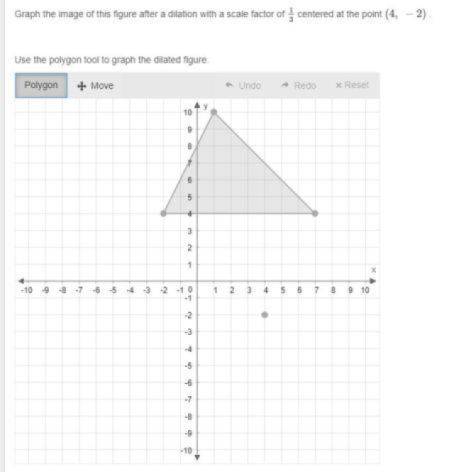
Need graph the image of this figure after a dilation with a scale factor of 1/3 centered at the point (4, −2).use the polygon tool to graph the dilated figure. the original points are (1, 10), (-2,4), and (7,4)

Answers: 1


Other questions on the subject: Mathematics
Mathematics, 21.06.2019 14:10, kyrabrown33
Line cd passes through points c(1, 3) and d(4, –3). if the equation of the line is written in slope-intercept form, y = mx + b, what is the value of b? –5 –2 1 5
Answers: 2
Mathematics, 21.06.2019 16:00, 710jonathan
Solve for x -2.3(r - 1.2 ) = -9.66 enter you answer as decimal.
Answers: 1
Mathematics, 21.06.2019 17:40, kayleeemerson77
The graph of h(x)= |x-10| +6 is shown. on which interval is this graph increasing
Answers: 2
Mathematics, 21.06.2019 22:00, michelle7511
The evening newspaper is delivered at a random time between 5: 30 and 6: 30 pm. dinner is at a random time between 6: 00 and 7: 00 pm. each spinner is spun 30 times and the newspaper arrived 19 times before dinner. determine the experimental probability of the newspaper arriving before dinner.
Answers: 1
Do you know the correct answer?
Need graph the image of this figure after a dilation with a scale factor of 1/3 centered at the poi...
Questions in other subjects:

English, 04.02.2021 19:10

Biology, 04.02.2021 19:10

Social Studies, 04.02.2021 19:10

Chemistry, 04.02.2021 19:10

Mathematics, 04.02.2021 19:10
English, 04.02.2021 19:10


