

Mathematics, 24.06.2019 01:00, JDKozlova
The two dot plots below show the heights of some sixth graders and some seventh graders. the mean absolute deviation (mad) for the first set of data is 1.2 and the mad for the second set of data is 0.6. approximately how many times the variability in the heights of the seventh graders is the variability in the heights of the sixth graders? answers: .3 1.2 1.7 2.0 show how you derived at the answer. you

Answers: 1


Other questions on the subject: Mathematics
Mathematics, 21.06.2019 20:30, PatienceJoy
If there is 20 dogs in the shelter and 5 dogs get homes, and then 43 more dogs come. how many dogs are there in the shelter?
Answers: 1
Mathematics, 22.06.2019 00:40, granniejo
The point (-7, -24) is on the terminal ray of angle 0 which is in standard position. a student found the six trigonometric values for angle e. the student's answers are shown. which value(s) are incorrect? sin(8) cos(8) 24 tan(0) sin(0)=25 cos(0) -- tan(ⓡ) - - 24 csc(o)=2 sec(0) --25 cot(6) - za csc(o) sec(0) cot(0) done
Answers: 3
Mathematics, 22.06.2019 02:00, connienash95
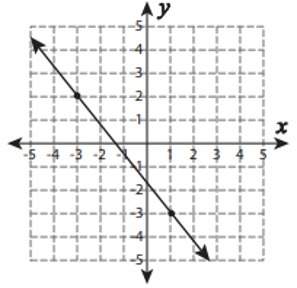
Which is the graph of the linear equation x – 2y = 6?
Answers: 2
Do you know the correct answer?
The two dot plots below show the heights of some sixth graders and some seventh graders. the mean ab...
Questions in other subjects:
Mathematics, 12.07.2019 06:30

Chemistry, 12.07.2019 06:30

History, 12.07.2019 06:30

English, 12.07.2019 06:30
Mathematics, 12.07.2019 06:30
Mathematics, 12.07.2019 06:30


