

Mathematics, 24.06.2019 18:30, brittanydeanlen
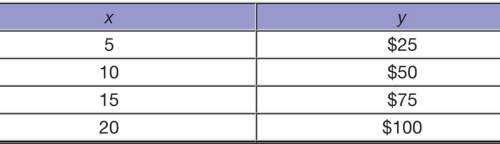
The table below shows the total cost of admittance to a basketball game, y, for x students. which explains how the table can be used to predict the cost of any number of students attending the game? a: the table is a partial representation of a larger data set. it can be used to generate a graph that is a complete representation of the data set. b: the table is a partial representation of a larger data set. it can be used to generate an equation that is a complete representation of the data set. c: the table is a complete representation of the data set. to determine the cost of any number of students, find the number of students in the x-column. d: the table is a complete representation of the data set. to determine the cost of any number of students, find the number of students in the y-column.

Answers: 1


Other questions on the subject: Mathematics
Mathematics, 21.06.2019 14:00, Badbpyz7987
(hurry! ) which expression is equivalent to the following complex fraction?
Answers: 1
Mathematics, 21.06.2019 20:00, sanafarghal
Find the value of x. give reasons to justify your solutions! l, m ∈ kn
Answers: 3
Do you know the correct answer?
The table below shows the total cost of admittance to a basketball game, y, for x students. which e...
Questions in other subjects:


Mathematics, 19.04.2021 16:30


