

Mathematics, 25.06.2019 14:00, nataliemakin7123
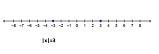
Debbie ran four time trials. first she ran 2/6 of a mile. then on each of the next three trials she ran 2/6 of a mile from her previous distance. draw a model or number line to represent one of debbie’s runs.

Answers: 2


Other questions on the subject: Mathematics
Mathematics, 21.06.2019 17:40, PONBallfordM89
How can the correlation in the scatter plot graph below best be described? positive correlation negative correlation both positive and negative no correlation
Answers: 1
Mathematics, 21.06.2019 23:00, lejeanjamespete1
Graph the system of equations. {6x−4y=−244x−8y=−32 use the line tool to graph the lines.
Answers: 1
Do you know the correct answer?
Debbie ran four time trials. first she ran 2/6 of a mile. then on each of the next three trials she...
Questions in other subjects:


Mathematics, 12.08.2020 07:01


